Cricket Wireless 2012 Annual Report Download - page 79
Download and view the complete annual report
Please find page 79 of the 2012 Cricket Wireless annual report below. You can navigate through the pages in the report by either clicking on the pages listed below, or by using the keyword search tool below to find specific information within the annual report.-
 1
1 -
2
-
3
-
4
-
5
-
6
-
7
-
8
-
9
-
10
-
11
-
12
-
13
-
14
-
15
-
16
-
17
-
18
-
19
-
20
-
21
-
22
-
23
-
24
-
25
-
26
-
27
-
28
-
29
-
30
-
31
-
32
-
33
-
34
-
35
-
36
-
37
-
38
-
39
-
40
-
41
-
42
-
43
-
44
-
45
-
46
-
47
-
48
-
49
-
50
-
51
-
52
-
53
-
54
-
55
-
56
-
57
-
58
-
59
-
60
-
61
-
62
-
63
-
64
-
65
-
66
-
67
-
68
-
 69
69 -
 70
70 -
 71
71 -
 72
72 -
 73
73 -
 74
74 -
 75
75 -
 76
76 -
 77
77 -
 78
78 -
 79
79 -
 80
80 -
 81
81 -
 82
82 -
 83
83 -
 84
84 -
 85
85 -
 86
86 -
 87
87 -
 88
88 -
 89
89 -
90
-
91
-
92
-
93
-
94
-
95
-
96
-
97
-
98
-
99
-
100
-
101
-
102
-
103
-
104
-
105
-
106
-
107
-
108
-
109
-
110
-
111
-
112
-
113
-
114
-
115
-
116
-
117
-
118
-
119
-
120
-
121
-
122
-
123
-
124
-
125
-
126
-
127
-
128
-
129
-
130
-
131
-
132
-
133
-
134
-
135
-
136
-
137
-
138
-
139
-
140
-
141
-
142
-
143
-
144
-
145
-
146
-
147
-
148
-
149
-
150
-
151
-
152
-
153
-
154
-
155
-
156
-
157
-
158
-
159
-
160
-
161
-
162
-
163
-
164
 |
 |

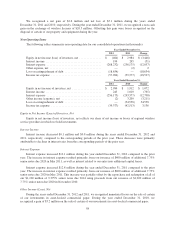
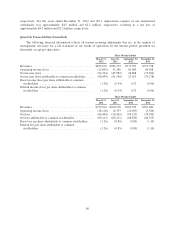
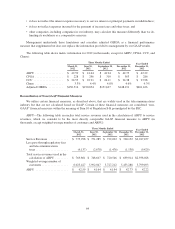
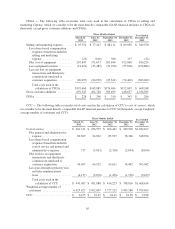
CPGA — The following table reconciles total costs used in the calculation of CPGA to selling and
marketing expense, which we consider to be the most directly comparable GAAP financial measure to CPGA (in
thousands, except gross customer additions and CPGA):
Three Months Ended Year Ended
December 31,
2012
March 31,
2012
June 30,
2012
September 30,
2012
December 31,
2012
Selling and marketing expense ...... $ 95,554 $ 77,247 $ 88,111 $ 89,058 $ 349,970
Less share-based compensation
(expense) benefit included in
selling and marketing
expense .................... (23) (616) 300 317 (22)
Plus cost of equipment .......... 247,847 171,673 203,846 192,860 816,226
Less equipment revenue ......... (51,621) (35,487) (51,950) (55,826) (194,884)
Less net loss on equipment
transactions and third-party
commissions unrelated to
customer acquisition .......... (96,097) (66,932) (65,611) (74,402) (303,042)
Total costs used in the
calculation of CPGA ....... $195,660 $145,885 $174,696 $152,007 $ 668,248
Gross customer additions .......... 859,547 492,720 563,459 418,657 2,334,383
CPGA ......................... $ 228 $ 296 $ 310 $ 363 $ 286
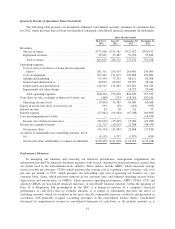
CCU — The following table reconciles total costs used in the calculation of CCU to cost of service, which
we consider to be the most directly comparable GAAP financial measure to CCU (in thousands, except weighted-
average number of customers and CCU):
Three Months Ended Year Ended
December 31,
2012
March 31,
2012
June 30,
2012
September 30,
2012
December 31,
2012
Cost of service ................. $ 261,311 $ 256,555 $ 266,401 $ 249,900 $1,034,167
Plus general and administrative
expense ................... 89,699 94,892 85,997 78,346 348,934
Less share-based compensation
(expense) benefit included in
cost of service and general and
administrative expense ....... 717 (3,813) (2,310) (2,694) (8,100)
Plus net loss on equipment
transactions and third-party
commissions unrelated to
customer acquisition ......... 96,097 66,932 65,611 74,402 303,042
Less pass-through regulatory fees
and telecommunications
taxes ..................... (4,137) (2,678) (1,476) (1,138) (9,429)
Total costs used in the
calculation of CCU ........ $ 443,687 $ 411,888 $ 414,223 $ 398,816 $1,668,614
Weighted-average number of
customers ................... 6,025,427 5,992,047 5,727,212 5,453,288 5,799,493
CCU ......................... $ 24.55 $ 22.91 $ 24.11 $ 24.38 $ 23.98
65