Cricket Wireless 2012 Annual Report Download - page 143
Download and view the complete annual report
Please find page 143 of the 2012 Cricket Wireless annual report below. You can navigate through the pages in the report by either clicking on the pages listed below, or by using the keyword search tool below to find specific information within the annual report.-
 1
1 -
2
-
3
-
4
-
5
-
6
-
7
-
8
-
9
-
10
-
11
-
12
-
13
-
14
-
15
-
16
-
17
-
18
-
19
-
20
-
21
-
22
-
23
-
24
-
25
-
26
-
27
-
28
-
29
-
30
-
31
-
32
-
33
-
34
-
35
-
36
-
37
-
38
-
39
-
40
-
41
-
42
-
43
-
44
-
45
-
46
-
47
-
48
-
49
-
50
-
51
-
52
-
53
-
54
-
55
-
56
-
57
-
58
-
59
-
60
-
61
-
62
-
63
-
64
-
65
-
66
-
67
-
68
-
69
-
70
-
71
-
72
-
73
-
74
-
75
-
76
-
77
-
78
-
79
-
80
-
81
-
82
-
83
-
84
-
85
-
86
-
87
-
88
-
89
-
90
-
91
-
92
-
93
-
94
-
95
-
96
-
97
-
98
-
99
-
100
-
101
-
102
-
103
-
104
-
105
-
106
-
107
-
108
-
109
-
110
-
111
-
112
-
113
-
114
-
115
-
116
-
117
-
118
-
119
-
120
-
121
-
122
-
123
-
124
-
125
-
126
-
127
-
128
-
129
-
130
-
131
-
132
-
 133
133 -
 134
134 -
 135
135 -
 136
136 -
 137
137 -
 138
138 -
 139
139 -
 140
140 -
 141
141 -
 142
142 -
 143
143 -
 144
144 -
 145
145 -
 146
146 -
 147
147 -
 148
148 -
 149
149 -
 150
150 -
 151
151 -
 152
152 -
 153
153 -
154
-
155
-
156
-
157
-
158
-
159
-
160
-
161
-
162
-
163
-
164
 |
 |

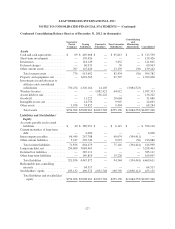
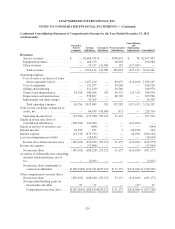
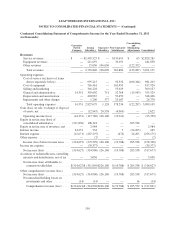
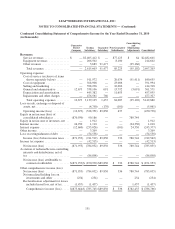
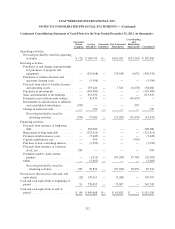
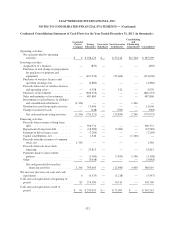
LEAP WIRELESS INTERNATIONAL, INC.
NOTES TO CONSOLIDATED FINANCIAL STATEMENTS — (Continued)
Condensed Consolidating Statement of Comprehensive Income for the Year Ended December 31, 2012
(in thousands):
Guarantor
Parent
Company
Issuing
Subsidiary
Guarantor
Subsidiary
Non-Guarantor
Subsidiaries
Consolidating
and
Eliminating
Adjustments Consolidated
Revenues:
Service revenues ................. $ —$2,608,538 $ — $338,841 $ 78 $2,947,457
Equipment revenues .............. — 168,279 — 26,605 — 194,884
Other revenues .................. — 15,317 111,981 197 (127,495) —
Total revenues ................. — 2,792,134 111,981 365,643 (127,417) 3,142,341
Operating expenses:
Cost of service (exclusive of items
shown separately below) ......... — 1,057,210 — 89,057 (112,100) 1,034,167
Cost of equipment ................ — 721,957 — 94,269 — 816,226
Selling and marketing ............. — 311,410 — 38,560 — 349,970
General and administrative ......... 10,556 306,206 762 46,727 (15,317) 348,934
Depreciation and amortization ...... — 578,827 — 46,769 — 625,596
Impairments and other charges ...... — 39,399 — — — 39,399
Total operating expenses ......... 10,556 3,015,009 762 315,382 (127,417) 3,214,292
Gain on sale, exchange or disposal of
assets, net ...................... — 84,939 143,904 871 — 229,714
Operating income (loss) ........... (10,556) (137,936) 255,123 51,132 — 157,763
Equity in net income (loss) of
consolidated subsidiaries .......... (190,241) 306,260 — — (116,019) —
Equity in net loss of investees, net ..... — (464) — — — (464)
Interest income .................... 24,252 187 — 5 (24,250) 194
Interest expense .................... (12,747) (279,735) — — 24,250 (268,232)
Loss on extinguishment of debt ....... — (18,634) — — — (18,634)
Income (loss) before income taxes . . . (189,292) (130,322) 255,123 51,137 (116,019) (129,373)
Income tax expense ................. — (57,904) — — — (57,904)
Net income (loss) ................ (189,292) (188,226) 255,123 51,137 (116,019) (187,277)
Accretion of redeemable non-controlling
interests and distributions, net of
tax ............................ — (2,015) — — — (2,015)
Net income (loss) attributable to
common stockholders ........... $(189,292)$ (190,241)$255,123 $ 51,137 $(116,019) $ (189,292)
Other comprehensive income (loss):
Net income (loss) ................ (189,292) (188,226) 255,123 51,137 (116,019) (187,277)
Net unrealized holding gains on
investments and other ........... 27 27 — — (27) 27
Comprehensive income (loss) ..... $(189,265)$ (188,199)$255,123 $ 51,137 $(116,046) $ (187,250)
129