Blackberry 2013 Annual Report Download - page 33
Download and view the complete annual report
Please find page 33 of the 2013 Blackberry annual report below. You can navigate through the pages in the report by either clicking on the pages listed below, or by using the keyword search tool below to find specific information within the annual report.-
 1
1 -
2
-
3
-
4
-
5
-
6
-
7
-
8
-
9
-
10
-
11
-
12
-
13
-
14
-
15
-
16
-
17
-
18
-
19
-
20
-
21
-
22
-
 23
23 -
 24
24 -
 25
25 -
 26
26 -
 27
27 -
 28
28 -
 29
29 -
 30
30 -
 31
31 -
 32
32 -
 33
33 -
 34
34 -
 35
35 -
 36
36 -
 37
37 -
 38
38 -
 39
39 -
 40
40 -
 41
41 -
 42
42 -
 43
43 -
44
-
45
-
46
-
47
-
48
-
49
-
50
-
51
-
52
-
53
-
54
-
55
-
56
-
57
-
58
-
59
-
60
-
61
-
62
-
63
-
64
-
65
-
66
-
67
-
68
-
69
-
70
-
71
-
72
-
73
-
74
-
75
-
76
-
77
-
78
-
79
-
80
-
81
-
82
-
83
-
84
-
85
-
86
-
87
-
88
-
89
-
90
-
91
-
92
-
93
-
94
-
95
-
96
-
97
-
98
-
99
-
100
-
101
-
102
-
103
-
104
-
105
-
106
-
107
-
108
-
109
-
110
-
111
-
112
-
113
-
114
-
115
-
116
-
117
-
118
-
119
-
120
-
121
-
122
-
123
-
124
-
125
-
126
-
127
-
128
-
129
-
130
-
131
-
132
-
133
-
134
-
135
-
136
-
137
-
138
-
139
-
140
-
141
-
142
-
143
-
144
-
145
-
146
-
147
-
148
-
149
-
150
-
151
-
152
-
153
-
154
-
155
-
156
-
157
-
158
-
159
-
160
-
161
-
162
-
163
-
164
-
165
-
166
-
167
-
168
-
169
-
170
-
171
-
172
-
173
-
174
-
175
-
176
-
177
-
178
-
179
-
180
-
181
-
182
-
183
-
184
-
185
-
186
-
187
-
188
-
189
-
190
-
191
-
192
-
193
-
194
-
195
-
196
-
197
-
198
-
199
-
200
-
201
-
202
-
203
-
204
-
205
-
206
-
207
-
208
-
209
-
210
-
211
-
212
-
213
-
214
-
215
-
216
-
217
-
218
-
219
-
220
-
221
-
222
-
223
-
224
-
225
-
226
-
227
-
228
-
229
-
230
-
231
-
232
-
233
-
234
-
235
 |
 |

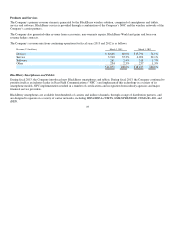
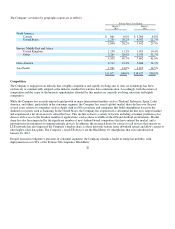
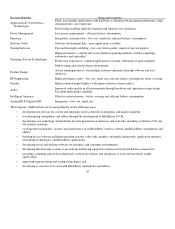
The Company’s revenues by geographic region are as follows:
Competition
The Company is engaged in an industry that is highly competitive and rapidly evolving and, to date, no technology has been
exclusively or commercially adopted as the industry standard for wireless data communication. Accordingly, both the nature of
competition and the scope of the business opportunities afforded by this market are currently evolving, uncertain and highly
competitive.
While the Company has recently enjoyed rapid growth in many international markets such as Thailand, Indonesia, Spain, Latin
America, and others, particularly in the consumer segment, the Company has seen its global market share decline over the past
several years relative to companies such as Apple with its iOS ecosystem, and companies that build smartphones based on the
Android ecosystem, such as Samsung. In the United States, the Company has experienced a substantial decline in its largest market
and experienced a net decrease in its subscriber base. This decline is due to a variety of factors including consumer preferences for
devices with access to the broadest number of applications, such as those available in the iOS and Android environments. Market
share has also been impacted by the significant number of new Android-based competitors that have entered the market, and a
growing trend in enterprises to support multiple devices. In addition, the increased desire by carriers to sell devices that operate on
LTE networks has also impacted the Company’s market share, as these networks feature faster download speeds and allow carriers to
offer higher-value data plans. The Company’s first LTE devices are the BlackBerry 10 smartphones that were introduced on
January 30, 2013.
Despite increased competitive pressures in consumer segments, the Company remains a leader in enterprise mobility, with
deployments in over 90% of the Fortune 500 companies. BlackBerry
26
For the Fiscal Year Ended
March 2,
2013
March 3,
2012
North America
Canada
$ 661 6.0% $ 1,260 6.8%
United States
2,235 20.2% 4,182 22.7%
2,896 26.2% 5,442
29.5%
Euro
p
e, Middle East and Africa
United Kin
g
dom
1,238 11.2% 1,919
10.4%
Other
3,264 29.5% 5,743 31.2%
4,502 40.7% 7,662
41.6%
Latin America
2,114 19.1% 2,646 14.4%
Asia Pacific
1,561 14.
0
% 2,673
14.5%
$11,073 100.
0
% $18,423 100.0%