Blackberry 2013 Annual Report Download - page 148
Download and view the complete annual report
Please find page 148 of the 2013 Blackberry annual report below. You can navigate through the pages in the report by either clicking on the pages listed below, or by using the keyword search tool below to find specific information within the annual report.-
 1
1 -
2
-
3
-
4
-
5
-
6
-
7
-
8
-
9
-
10
-
11
-
12
-
13
-
14
-
15
-
16
-
17
-
18
-
19
-
20
-
21
-
22
-
23
-
24
-
25
-
26
-
27
-
28
-
29
-
30
-
31
-
32
-
33
-
34
-
35
-
36
-
37
-
38
-
39
-
40
-
41
-
42
-
43
-
44
-
45
-
46
-
47
-
48
-
49
-
50
-
51
-
52
-
53
-
54
-
55
-
56
-
57
-
58
-
59
-
60
-
61
-
62
-
63
-
64
-
65
-
66
-
67
-
68
-
69
-
70
-
71
-
72
-
73
-
74
-
75
-
76
-
77
-
78
-
79
-
80
-
81
-
82
-
83
-
84
-
85
-
86
-
87
-
88
-
89
-
90
-
91
-
92
-
93
-
94
-
95
-
96
-
97
-
98
-
99
-
100
-
101
-
102
-
103
-
104
-
105
-
106
-
107
-
108
-
109
-
110
-
111
-
112
-
113
-
114
-
115
-
116
-
117
-
118
-
119
-
120
-
121
-
122
-
123
-
124
-
125
-
126
-
127
-
128
-
129
-
130
-
131
-
132
-
133
-
134
-
135
-
136
-
137
-
 138
138 -
 139
139 -
 140
140 -
 141
141 -
 142
142 -
 143
143 -
 144
144 -
 145
145 -
 146
146 -
 147
147 -
 148
148 -
 149
149 -
 150
150 -
 151
151 -
 152
152 -
 153
153 -
 154
154 -
 155
155 -
 156
156 -
 157
157 -
 158
158 -
159
-
160
-
161
-
162
-
163
-
164
-
165
-
166
-
167
-
168
-
169
-
170
-
171
-
172
-
173
-
174
-
175
-
176
-
177
-
178
-
179
-
180
-
181
-
182
-
183
-
184
-
185
-
186
-
187
-
188
-
189
-
190
-
191
-
192
-
193
-
194
-
195
-
196
-
197
-
198
-
199
-
200
-
201
-
202
-
203
-
204
-
205
-
206
-
207
-
208
-
209
-
210
-
211
-
212
-
213
-
214
-
215
-
216
-
217
-
218
-
219
-
220
-
221
-
222
-
223
-
224
-
225
-
226
-
227
-
228
-
229
-
230
-
231
-
232
-
233
-
234
-
235
 |
 |

Research In Motion Limited
Notes to the Consolidated Financial Statements
In millions of United States dollars, except share and per share data, and except as otherwise indicated
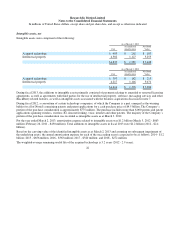
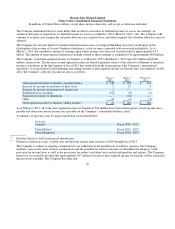
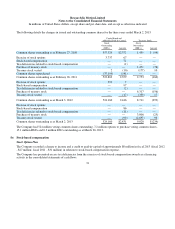
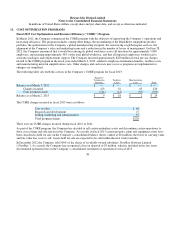
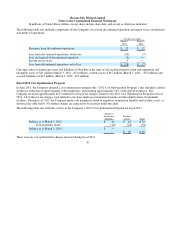
Stock options previously granted under the plan generally vest over a period of three years to a maximum of five years and are
generally exercisable over a period of five years to a maximum of seven years from the grant date. The Company issues new
shares to satisfy stock option exercises. There are five million shares in the equity pool available for future grants under the
Company’s equity plans as at March 2, 2013.
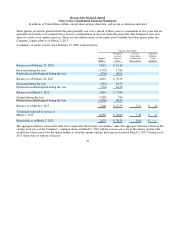
A summary of option activity since February 27, 2010 is shown below:
The aggregate intrinsic value in the table above represents the total pre-tax intrinsic value (the aggregate difference between the
closing stock price of the Company’s common shares on March 2, 2013 and the exercise price for in-the-money options) that
would have been received by the option holders if all in-the-money options had been exercised on March 2, 2013. During fiscal
2013, there were no options exercised.
32
Options Outstanding
Number
(000’s)
Weighted-
Average
Exercise
Price
Average
Remaining
Contractual
Life in Years
Aggregate
Intrinsic
Value
(millions)
Balance as at Februar
y
27, 2010
9,023 $44.18
Exercised durin
g
the
y
ear
(3,737) 17.83
Forfeited/cancelled/ex
p
ired durin
g
the
y
ear
(676) 46.08
Balance as at Februar
y
26, 2011
4,610 $ 70.36
Exercised durin
g
the
y
ear
(291) 29.70
Forfeited/cancelled/ex
p
ired durin
g
the
y
ear
(701) 64.58
Balance as at March 3, 2012
3,618 $73.86
Granted durin
g
the
y
ear
5,288 7.86
Forfeited/cancelled/ex
p
ired durin
g
the
y
ear
(1,646) 60.86
Balance as at March 2, 2013
7,260 $ 27.53 3.51
$29
Vested and ex
p
ected to vest as at
March 2, 2013
6,869 $ 28.60 3.45
$27
Exercisable as at March 2, 2013
2,073 $74.76 0.91 $
—