Blackberry 2013 Annual Report Download - page 212
Download and view the complete annual report
Please find page 212 of the 2013 Blackberry annual report below. You can navigate through the pages in the report by either clicking on the pages listed below, or by using the keyword search tool below to find specific information within the annual report.-
 1
1 -
2
-
3
-
4
-
5
-
6
-
7
-
8
-
9
-
10
-
11
-
12
-
13
-
14
-
15
-
16
-
17
-
18
-
19
-
20
-
21
-
22
-
23
-
24
-
25
-
26
-
27
-
28
-
29
-
30
-
31
-
32
-
33
-
34
-
35
-
36
-
37
-
38
-
39
-
40
-
41
-
42
-
43
-
44
-
45
-
46
-
47
-
48
-
49
-
50
-
51
-
52
-
53
-
54
-
55
-
56
-
57
-
58
-
59
-
60
-
61
-
62
-
63
-
64
-
65
-
66
-
67
-
68
-
69
-
70
-
71
-
72
-
73
-
74
-
75
-
76
-
77
-
78
-
79
-
80
-
81
-
82
-
83
-
84
-
85
-
86
-
87
-
88
-
89
-
90
-
91
-
92
-
93
-
94
-
95
-
96
-
97
-
98
-
99
-
100
-
101
-
102
-
103
-
104
-
105
-
106
-
107
-
108
-
109
-
110
-
111
-
112
-
113
-
114
-
115
-
116
-
117
-
118
-
119
-
120
-
121
-
122
-
123
-
124
-
125
-
126
-
127
-
128
-
129
-
130
-
131
-
132
-
133
-
134
-
135
-
136
-
137
-
138
-
139
-
140
-
141
-
142
-
143
-
144
-
145
-
146
-
147
-
148
-
149
-
150
-
151
-
152
-
153
-
154
-
155
-
156
-
157
-
158
-
159
-
160
-
161
-
162
-
163
-
164
-
165
-
166
-
167
-
168
-
169
-
170
-
171
-
172
-
173
-
174
-
175
-
176
-
177
-
178
-
179
-
180
-
181
-
182
-
183
-
184
-
185
-
186
-
187
-
188
-
189
-
190
-
191
-
192
-
193
-
194
-
195
-
196
-
197
-
198
-
199
-
200
-
201
-
 202
202 -
 203
203 -
 204
204 -
 205
205 -
 206
206 -
 207
207 -
 208
208 -
 209
209 -
 210
210 -
 211
211 -
 212
212 -
 213
213 -
 214
214 -
 215
215 -
 216
216 -
 217
217 -
 218
218 -
 219
219 -
 220
220 -
 221
221 -
 222
222 -
223
-
224
-
225
-
226
-
227
-
228
-
229
-
230
-
231
-
232
-
233
-
234
-
235
 |
 |

Research In Motion Limited
Management’s Discussion and Analysis of Financial Condition and Results of Operations
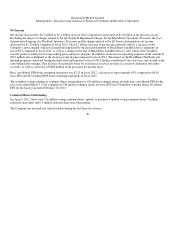
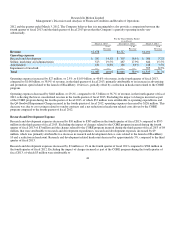
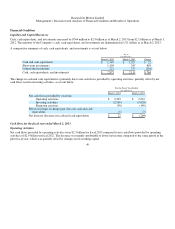
Company’s effective income tax recovery rate reflects the geographic mix of earnings in jurisdictions with different income tax rates.
The higher effective income tax recovery rate in the fourth quarter of fiscal 2013 primarily reflects the favourable impacts of carrying
operating losses back to prior periods with higher effective income tax rates, the effect of income tax incentives on earnings including
the extension of the US Federal R&D credit that was enacted in the fourth quarter of fiscal 2013 and the goodwill impairment charge
incurred in the fourth quarter of fiscal 2012.
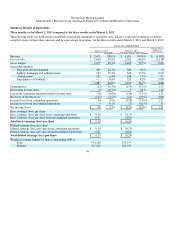
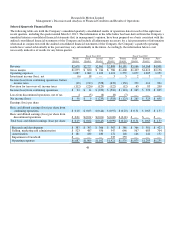
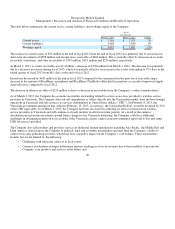
Net Income
The Company’s net income from continuing operations for the fourth quarter of fiscal 2013 was $94 million, an increase of $212
million compared to a net loss from continuing operations of $118 million in the fourth quarter of fiscal 2012. The increase, which
takes into account the impact of restructuring charges of $29 million related to the CORE program incurred in the fourth quarter of
fiscal 2013, as well as the impacts of the Q4 Goodwill Impairment Charge, the PlayBook Inventory Provision and the BB7 Inventory
Provision incurred in the fourth quarter of fiscal 2012, is primarily attributable to a decrease in the Company’s gross margin, partially
offset by a reduction in operating expenses and a recovery of income taxes. The Company’s consolidated gross margin in the fourth
quarter of fiscal 2013 was negatively impacted by the lower shipment volumes as a result of the Company’s aging product portfolio in
a very competitive environment in which multiple competitors introduced new devices beginning in early fiscal 2013 as well as the
impact of allocating certain fixed costs, including licensing costs, to lower shipment volumes, compared to the fourth quarter of fiscal
2012. The decrease in gross margin was partially offset by the higher average selling prices of BlackBerry 10 devices shipped,
favorable renegotiations of key contracts associated with elements of the Company’s hardware business and benefits from a leaner
and re-architected supply chain.
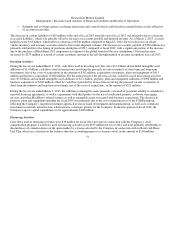
Basic and diluted EPS from continuing operations were both $0.18 in the fourth quarter of fiscal 2013, compared to basic and diluted
loss per share from continuing operations of $0.23 in the fourth quarter of fiscal 2012.
The weighted average number of shares outstanding was 524 million common shares for basic EPS and 527 million for diluted EPS
for the fourth quarter of fiscal 2013, compared to 524 for both basic and diluted loss per share for the fourth quarter of fiscal 2012.
47