Blackberry 2013 Annual Report Download - page 186
Download and view the complete annual report
Please find page 186 of the 2013 Blackberry annual report below. You can navigate through the pages in the report by either clicking on the pages listed below, or by using the keyword search tool below to find specific information within the annual report.-
 1
1 -
2
-
3
-
4
-
5
-
6
-
7
-
8
-
9
-
10
-
11
-
12
-
13
-
14
-
15
-
16
-
17
-
18
-
19
-
20
-
21
-
22
-
23
-
24
-
25
-
26
-
27
-
28
-
29
-
30
-
31
-
32
-
33
-
34
-
35
-
36
-
37
-
38
-
39
-
40
-
41
-
42
-
43
-
44
-
45
-
46
-
47
-
48
-
49
-
50
-
51
-
52
-
53
-
54
-
55
-
56
-
57
-
58
-
59
-
60
-
61
-
62
-
63
-
64
-
65
-
66
-
67
-
68
-
69
-
70
-
71
-
72
-
73
-
74
-
75
-
76
-
77
-
78
-
79
-
80
-
81
-
82
-
83
-
84
-
85
-
86
-
87
-
88
-
89
-
90
-
91
-
92
-
93
-
94
-
95
-
96
-
97
-
98
-
99
-
100
-
101
-
102
-
103
-
104
-
105
-
106
-
107
-
108
-
109
-
110
-
111
-
112
-
113
-
114
-
115
-
116
-
117
-
118
-
119
-
120
-
121
-
122
-
123
-
124
-
125
-
126
-
127
-
128
-
129
-
130
-
131
-
132
-
133
-
134
-
135
-
136
-
137
-
138
-
139
-
140
-
141
-
142
-
143
-
144
-
145
-
146
-
147
-
148
-
149
-
150
-
151
-
152
-
153
-
154
-
155
-
156
-
157
-
158
-
159
-
160
-
161
-
162
-
163
-
164
-
165
-
166
-
167
-
168
-
169
-
170
-
171
-
172
-
173
-
174
-
175
-
 176
176 -
 177
177 -
 178
178 -
 179
179 -
 180
180 -
 181
181 -
 182
182 -
 183
183 -
 184
184 -
 185
185 -
 186
186 -
 187
187 -
 188
188 -
 189
189 -
 190
190 -
 191
191 -
 192
192 -
 193
193 -
 194
194 -
 195
195 -
 196
196 -
197
-
198
-
199
-
200
-
201
-
202
-
203
-
204
-
205
-
206
-
207
-
208
-
209
-
210
-
211
-
212
-
213
-
214
-
215
-
216
-
217
-
218
-
219
-
220
-
221
-
222
-
223
-
224
-
225
-
226
-
227
-
228
-
229
-
230
-
231
-
232
-
233
-
234
-
235
 |
 |

Research In Motion Limited
Management’s Discussion and Analysis of Financial Condition and Results of Operations
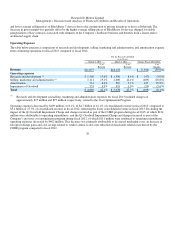
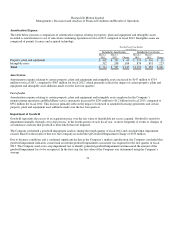
Investments
The Company’s cash equivalents and investments, other than cost method investments of $4 million and equity method investments
of $48 million, consist of money market and other debt securities, and are classified as available-for-sale for accounting purposes and
are carried at fair value with unrealized gains and losses recorded in accumulated other comprehensive income until such investments
mature or are sold. The Company uses the specific identification method of determining the cost basis in computing realized gains or
losses on available-for-sale investments which are recorded in investment income. In the event of a decline in value which is other
than temporary, the investment is written down to fair value with a charge to income.
The Company defines fair value as the price that would be received to sell an asset or paid to transfer a liability in an orderly
transaction between market participants at the measurement date. When determining the fair value measurements for assets and
liabilities required to be recorded at fair value, the Company considers the principal or most advantageous market in which it would
transact and considers assumptions that market participants would use in pricing the asset or liability, such as inherent risk, non-
performance risk and credit risk. The Company applies the following fair value hierarchy, which prioritizes the inputs used in the
valuation methodologies in measuring fair value into three levels:
The fair value hierarchy also requires the Company to maximize the use of observable inputs and minimize the use of unobservable
inputs when measuring fair value.
The carrying amounts of the Company’s cash and cash equivalents, accounts receivable, other receivables, accounts payable and
accrued liabilities approximate fair value due to their short maturities.
In determining the fair value of investments held, the Company primarily relies on an independent third party valuator for the fair
valuation of securities. Pricing inputs used by the independent third party valuator are generally received from two primary vendors.
The pricing inputs are reviewed for completeness and accuracy, within a set tolerance level, on a daily basis by the independent third
party valuator. The Company also reviews and understands the inputs used in the valuation process and assesses the pricing of the
securities for reasonableness.
For further details on the valuation methods and inputs used by the Company to determine the fair value of its investments, refer to
Note 5 to the Consolidated Financial Statements.
Given the current market conditions and economic uncertainties, management exercises significant judgment in determining the fair
value of the Company’s investments and the investment’s classification level within the three-tier fair value hierarchy. As at March 2,
2013, the Company had approximately 98% of its available-for-sale investments measured at fair value classified in Level 2.
21
• Level 1 - Unad
j
usted
q
uoted
p
rices at the measurement date for identical assets or liabilities in active markets;
• Level 2 - Observable inputs other than quoted prices included in Level 1, such as quoted prices for similar assets and
liabilities in active markets; quoted prices for identical or similar assets and liabilities in markets that are not active; or
other in
p
uts that are observable or can be corroborated b
y
observable market data; and
• Level 3 - Si
g
nificant unobservable in
p
uts which are su
pp
orted b
y
little or no market activit
y
.