Blackberry 2013 Annual Report Download - page 177
Download and view the complete annual report
Please find page 177 of the 2013 Blackberry annual report below. You can navigate through the pages in the report by either clicking on the pages listed below, or by using the keyword search tool below to find specific information within the annual report.-
 1
1 -
2
-
3
-
4
-
5
-
6
-
7
-
8
-
9
-
10
-
11
-
12
-
13
-
14
-
15
-
16
-
17
-
18
-
19
-
20
-
21
-
22
-
23
-
24
-
25
-
26
-
27
-
28
-
29
-
30
-
31
-
32
-
33
-
34
-
35
-
36
-
37
-
38
-
39
-
40
-
41
-
42
-
43
-
44
-
45
-
46
-
47
-
48
-
49
-
50
-
51
-
52
-
53
-
54
-
55
-
56
-
57
-
58
-
59
-
60
-
61
-
62
-
63
-
64
-
65
-
66
-
67
-
68
-
69
-
70
-
71
-
72
-
73
-
74
-
75
-
76
-
77
-
78
-
79
-
80
-
81
-
82
-
83
-
84
-
85
-
86
-
87
-
88
-
89
-
90
-
91
-
92
-
93
-
94
-
95
-
96
-
97
-
98
-
99
-
100
-
101
-
102
-
103
-
104
-
105
-
106
-
107
-
108
-
109
-
110
-
111
-
112
-
113
-
114
-
115
-
116
-
117
-
118
-
119
-
120
-
121
-
122
-
123
-
124
-
125
-
126
-
127
-
128
-
129
-
130
-
131
-
132
-
133
-
134
-
135
-
136
-
137
-
138
-
139
-
140
-
141
-
142
-
143
-
144
-
145
-
146
-
147
-
148
-
149
-
150
-
151
-
152
-
153
-
154
-
155
-
156
-
157
-
158
-
159
-
160
-
161
-
162
-
163
-
164
-
165
-
166
-
 167
167 -
 168
168 -
 169
169 -
 170
170 -
 171
171 -
 172
172 -
 173
173 -
 174
174 -
 175
175 -
 176
176 -
 177
177 -
 178
178 -
 179
179 -
 180
180 -
 181
181 -
 182
182 -
 183
183 -
 184
184 -
 185
185 -
 186
186 -
 187
187 -
188
-
189
-
190
-
191
-
192
-
193
-
194
-
195
-
196
-
197
-
198
-
199
-
200
-
201
-
202
-
203
-
204
-
205
-
206
-
207
-
208
-
209
-
210
-
211
-
212
-
213
-
214
-
215
-
216
-
217
-
218
-
219
-
220
-
221
-
222
-
223
-
224
-
225
-
226
-
227
-
228
-
229
-
230
-
231
-
232
-
233
-
234
-
235
 |
 |
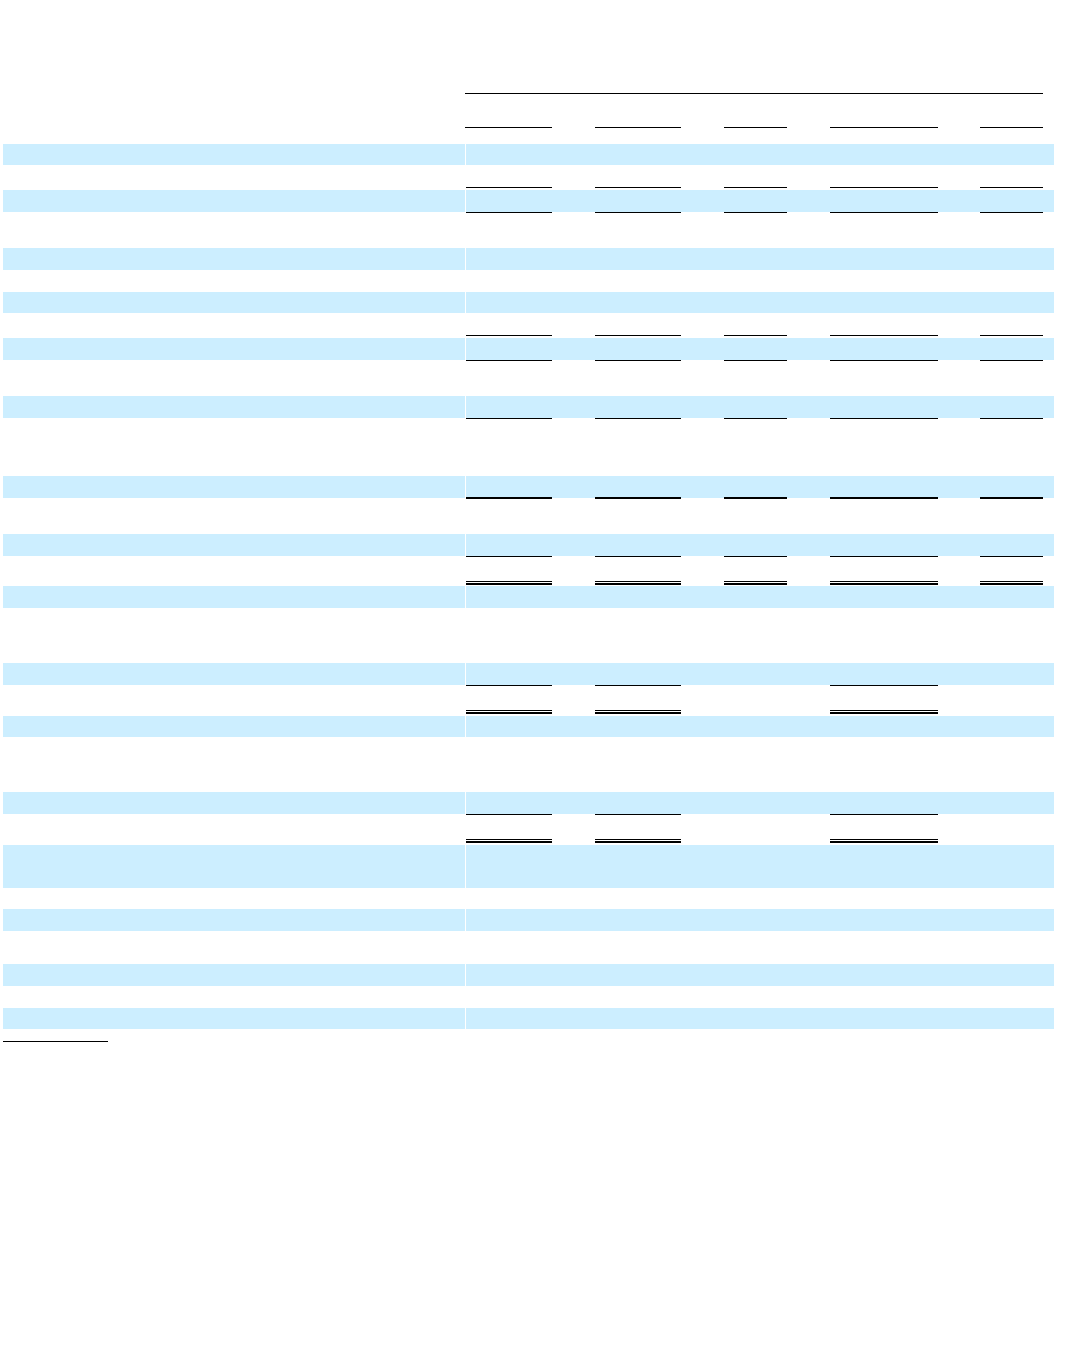
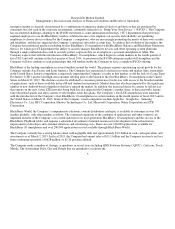
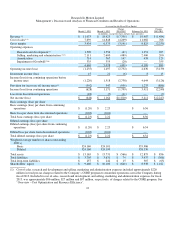
Research In Motion Limited
Management’s Discussion and Analysis of Financial Condition and Results of Operations
12
As at and for the Fiscal Year Ended
March 2, 2013 March 3, 2012
Change
2013/2012 February 26, 2011
Change
2012/2011
(in millions, except for share and per share amounts)
Revenue
$11,073 $ 18,423 $ (7,35
0
) $19,907 $(1,484)
Cost of sales
7,639 11,848 (4,209)
11,082
766
Gross mar
g
in
3,434 6,575 (3,141) 8,825 (2,250)
O
p
eratin
g
ex
p
enses
Research and develo
p
ment
1,509 1,556 (47) 1,351 205
Sellin
g
, marketin
g
and administration
2,111
2,600 (489) 2,40
0
200
Amortization
714 567 147 438 129
Im
p
airment of Goodwill
335 355 (2
0
)
—
355
4,669 5,078 (409) 4,189 889
O
p
eratin
g
income (loss)
(1,235)
1,497 (2,732) 4,636
(3,139)
Investment income (loss)
15 21 (6) 8 13
Income (loss) from continuing operations before
income taxes
(1,220)
1,518 (2,738) 4,644
(3,126)
Provision for (recover
y
of) income taxes (592) 347 (939) 1,233 (886)
Income (loss) from continuin
g
o
p
erations (628)
1,171 (1,799) 3,411
(2,240)
Loss from discontinued o
p
erations
(18) (7) (11)
—
(7)
Net income (loss)
$ (646) $ 1,164 $ (1,81
0
) $ 3,411 $ (2,247)
Basic earnin
g
s (loss)
p
er share
Basic earnings (loss) per share from continuing
o
p
erations
$ (1.20) $2.23
$ 6.36
Basic loss
p
er share from discontinued o
p
erations
(0.03) (0.01)
—
Total basic earnin
g
s (loss)
p
er share
$ (1.23) $2.22
$ 6.36
Diluted earnin
g
s (loss)
p
er share
Diluted earnings (loss) per share from continuing
o
p
erations
$ (1.20) $2.23
$ 6.34
Diluted loss
p
er share from discontinued o
p
erations
(0.03) (0.01)
—
Total diluted earnin
g
s (loss)
p
er share
$ (1.23) $2.22
$ 6.34
Weighted-average number of shares outstanding
(00
0
’s)
Basic
524,160
524,101
535,986
Diluted
524,160 524,190 538,33
0
Total assets
$ 13,165 $ 13,731 $ (566) $ 12,875 $ 856
Total liabilities
$3,705 $ 3,631 $ 74 $3,937 $(306)
Total lon
g
-term liabilities
$ 257 $ 242 $15 $ 307 $ (65)
Shareholders’ e
q
uit
y
$9,460 $10,100 $(64
0
) $8,938 $1,162
(1) Cost of sales, research and development and selling, marketing and administration expenses included approximately $220
million in total pre-tax charges related to the Company’s CORE program to streamline operations across the Company during
fiscal 2013. Included in cost of sales, research and development, and selling, marketing and administration expenses for fiscal
2013, was approximately $96 million, $27 million and $97 million, respectively, of charges related to the CORE program. See
“Overview
–
Cost O
p
timization and Resource Efficienc
y
”.
(5)
(1,4)
(1)
(1)(3)
(2)(6)
(3)