Blackberry 2013 Annual Report Download - page 201
Download and view the complete annual report
Please find page 201 of the 2013 Blackberry annual report below. You can navigate through the pages in the report by either clicking on the pages listed below, or by using the keyword search tool below to find specific information within the annual report.-
 1
1 -
2
-
3
-
4
-
5
-
6
-
7
-
8
-
9
-
10
-
11
-
12
-
13
-
14
-
15
-
16
-
17
-
18
-
19
-
20
-
21
-
22
-
23
-
24
-
25
-
26
-
27
-
28
-
29
-
30
-
31
-
32
-
33
-
34
-
35
-
36
-
37
-
38
-
39
-
40
-
41
-
42
-
43
-
44
-
45
-
46
-
47
-
48
-
49
-
50
-
51
-
52
-
53
-
54
-
55
-
56
-
57
-
58
-
59
-
60
-
61
-
62
-
63
-
64
-
65
-
66
-
67
-
68
-
69
-
70
-
71
-
72
-
73
-
74
-
75
-
76
-
77
-
78
-
79
-
80
-
81
-
82
-
83
-
84
-
85
-
86
-
87
-
88
-
89
-
90
-
91
-
92
-
93
-
94
-
95
-
96
-
97
-
98
-
99
-
100
-
101
-
102
-
103
-
104
-
105
-
106
-
107
-
108
-
109
-
110
-
111
-
112
-
113
-
114
-
115
-
116
-
117
-
118
-
119
-
120
-
121
-
122
-
123
-
124
-
125
-
126
-
127
-
128
-
129
-
130
-
131
-
132
-
133
-
134
-
135
-
136
-
137
-
138
-
139
-
140
-
141
-
142
-
143
-
144
-
145
-
146
-
147
-
148
-
149
-
150
-
151
-
152
-
153
-
154
-
155
-
156
-
157
-
158
-
159
-
160
-
161
-
162
-
163
-
164
-
165
-
166
-
167
-
168
-
169
-
170
-
171
-
172
-
173
-
174
-
175
-
176
-
177
-
178
-
179
-
180
-
181
-
182
-
183
-
184
-
185
-
186
-
187
-
188
-
189
-
190
-
 191
191 -
 192
192 -
 193
193 -
 194
194 -
 195
195 -
 196
196 -
 197
197 -
 198
198 -
 199
199 -
 200
200 -
 201
201 -
 202
202 -
 203
203 -
 204
204 -
 205
205 -
 206
206 -
 207
207 -
 208
208 -
 209
209 -
 210
210 -
 211
211 -
212
-
213
-
214
-
215
-
216
-
217
-
218
-
219
-
220
-
221
-
222
-
223
-
224
-
225
-
226
-
227
-
228
-
229
-
230
-
231
-
232
-
233
-
234
-
235
 |
 |

Research In Motion Limited
Management’s Discussion and Analysis of Financial Condition and Results of Operations
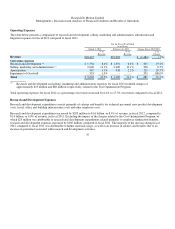
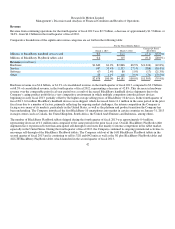
Sales outside the United States, the United Kingdom and Canada comprised approximately 60% of the total consolidated revenue
during fiscal 2012. Sales in the United States represented approximately 23% of total consolidated revenue during the year, a decrease
as a percentage of total consolidated revenue compared to the prior year resulting from factors described above, shifts in the
competitive dynamics within the United States, an increase of in-life products that makes up the Company’s product mix, as well as
growth in international markets compared to fiscal 2011. Sales in the United Kingdom represented approximately 10% of total
consolidated revenue and sales in Canada represented the remainder. During fiscal 2012, the Company experienced a significant
decrease in its share of the smartphone market in the United States compared to fiscal 2011. Intense competition, the lack of an LTE
product and a high-end consumer offering in the United States is negatively impacting the Company’s results in that market. The
Company has also encountered challenges due to the impact of BYOD strategies being adopted by some of its enterprise customers,
as some IT departments that previously required employees to use the BlackBerry wireless solution because of its emphasis on
security and reliability are permitting employees to choose devices offered by the Company’s competitors.
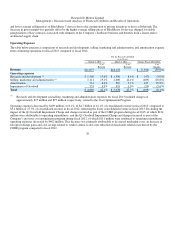
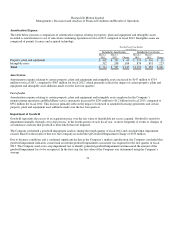
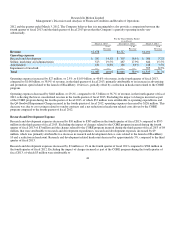
Gross Margin
Consolidated gross margin from continuing operations decreased by $2.2 billion, or approximately 25.5%, to $6.6 billion, or 35.7% o
f
consolidated revenue, in fiscal 2012, compared to $8.8 billion, or 44.3% of consolidated revenue, in fiscal 2011.
During the fourth quarter of fiscal 2012, the Company recorded the Q4 BlackBerry Inventory Provision consisting of pre-tax charges
of approximately $267 million, or approximately $197 million after-tax, relating primarily to certain BlackBerry 7 products with its
current portfolio of hardware devices. The non-cash charges represent the Company’s estimates of provisions required to sell through
existing inventory in the channel based on estimated inventory levels of certain BlackBerry 7 products, as well as related vendor
liabilities as of March 3, 2012. The Company also experienced a decrease in its forward-looking demand relating to certain
BlackBerry 7 products and as such, recorded a reduction in the carrying value of its inventory, and increased its estimate of the excess
inventory and contractual liabilities with its manufacturing partners for units or materials relating to those products.
Excluding the impact of the charges related to the Q4 BlackBerry 7 Inventory Provision, the Cost Optimization Program, the
PlayBook Inventory Provision and the charges related to the Q3 Service Interruption, consolidated gross margin decreased by $1.4
billion compared to fiscal 2011. The decline in consolidated gross margin percentage was primarily attributable to the decreased
number of BlackBerry handheld device shipments in fiscal 2012 compared to fiscal 2011, as well as the mix of BlackBerry handheld
devices sold during fiscal 2012, which were weighted towards in-life products with lower average selling prices and gross margins.
The impact of the BlackBerry PlayBook sell-through programs conducted during the third and fourth quarters of fiscal 2012 further
contributed to the year-over-year decline in the consolidated gross margin. The overall decline was partially offset by an increase in
service revenue as a result of additional subscriber accounts, which comprised 22.1% of the total revenue mix for fiscal 2012
compared to 16.1% in fiscal 2011. Gross margin percentage for BlackBerry handheld devices and BlackBerry PlayBook tablets are
generally lower than the Company’s consolidated gross margin percentage.
36