Blackberry 2013 Annual Report Download - page 203
Download and view the complete annual report
Please find page 203 of the 2013 Blackberry annual report below. You can navigate through the pages in the report by either clicking on the pages listed below, or by using the keyword search tool below to find specific information within the annual report.-
 1
1 -
2
-
3
-
4
-
5
-
6
-
7
-
8
-
9
-
10
-
11
-
12
-
13
-
14
-
15
-
16
-
17
-
18
-
19
-
20
-
21
-
22
-
23
-
24
-
25
-
26
-
27
-
28
-
29
-
30
-
31
-
32
-
33
-
34
-
35
-
36
-
37
-
38
-
39
-
40
-
41
-
42
-
43
-
44
-
45
-
46
-
47
-
48
-
49
-
50
-
51
-
52
-
53
-
54
-
55
-
56
-
57
-
58
-
59
-
60
-
61
-
62
-
63
-
64
-
65
-
66
-
67
-
68
-
69
-
70
-
71
-
72
-
73
-
74
-
75
-
76
-
77
-
78
-
79
-
80
-
81
-
82
-
83
-
84
-
85
-
86
-
87
-
88
-
89
-
90
-
91
-
92
-
93
-
94
-
95
-
96
-
97
-
98
-
99
-
100
-
101
-
102
-
103
-
104
-
105
-
106
-
107
-
108
-
109
-
110
-
111
-
112
-
113
-
114
-
115
-
116
-
117
-
118
-
119
-
120
-
121
-
122
-
123
-
124
-
125
-
126
-
127
-
128
-
129
-
130
-
131
-
132
-
133
-
134
-
135
-
136
-
137
-
138
-
139
-
140
-
141
-
142
-
143
-
144
-
145
-
146
-
147
-
148
-
149
-
150
-
151
-
152
-
153
-
154
-
155
-
156
-
157
-
158
-
159
-
160
-
161
-
162
-
163
-
164
-
165
-
166
-
167
-
168
-
169
-
170
-
171
-
172
-
173
-
174
-
175
-
176
-
177
-
178
-
179
-
180
-
181
-
182
-
183
-
184
-
185
-
186
-
187
-
188
-
189
-
190
-
191
-
192
-
 193
193 -
 194
194 -
 195
195 -
 196
196 -
 197
197 -
 198
198 -
 199
199 -
 200
200 -
 201
201 -
 202
202 -
 203
203 -
 204
204 -
 205
205 -
 206
206 -
 207
207 -
 208
208 -
 209
209 -
 210
210 -
 211
211 -
 212
212 -
 213
213 -
214
-
215
-
216
-
217
-
218
-
219
-
220
-
221
-
222
-
223
-
224
-
225
-
226
-
227
-
228
-
229
-
230
-
231
-
232
-
233
-
234
-
235
 |
 |

Research In Motion Limited
Management’s Discussion and Analysis of Financial Condition and Results of Operations
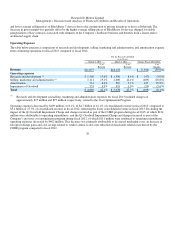
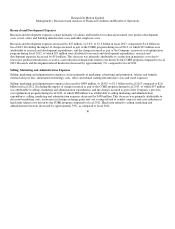
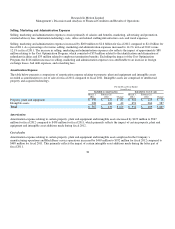
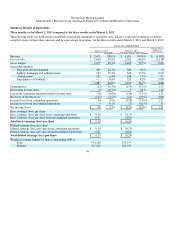
Selling, Marketing and Administration Expenses
Selling, marketing and administration expenses consist primarily of salaries and benefits, marketing, advertising and promotion,
external advisory fees, information technology costs, office and related staffing infrastructure costs and travel expenses.
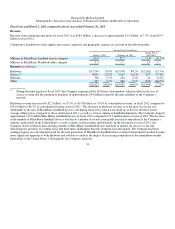
Selling, marketing and administration expenses increased by $200 million to $2.6 billion for fiscal 2012 compared to $2.4 billion for
fiscal 2011. As a percentage of revenue, selling, marketing and administration expenses increased to 14.1% in fiscal 2012 versus
12.1% in fiscal 2011. The increase in selling, marketing and administration expenses also reflects the impact of approximately $88
million relating to the Cost Optimization Program, which consisted of $53 million related to the identification and elimination of
redundant facilities and $35 million related to employee termination benefits. Excluding the impact of the Cost Optimization
Program, the $116 million increase in selling, marketing and administration expenses was attributable to an increase in foreign
exchange losses, bad debt expenses, and consulting fees.
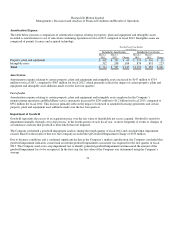
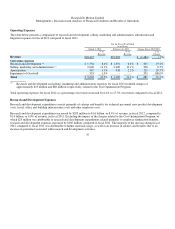
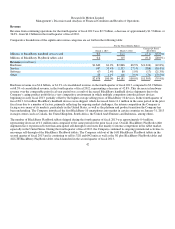
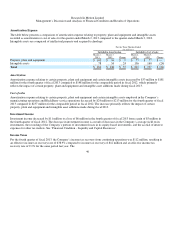
Amortization Expense
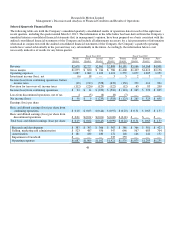
The table below presents a comparison of amortization expense relating to property, plant and equipment and intangible assets
recorded as amortization or cost of sales for fiscal 2012 compared to fiscal 2011. Intangible assets are comprised of intellectual
property and acquired technology.
A
mortization
Amortization expense relating to certain property, plant and equipment and intangible assets increased by $129 million to $567
million for fiscal 2012 compared to $438 million for fiscal 2011, which primarily reflects the impact of certain property, plant and
equipment and intangible asset additions made during fiscal 2012.
Cost of sales
Amortization expense relating to certain property, plant and equipment and intangible assets employed in the Company’s
manufacturing operations and BlackBerry service operations increased by $463 million to $952 million for fiscal 2012 compared to
$489 million for fiscal 2011. This primarily reflects the impact of certain intangible asset additions made during the latter part of
fiscal 2011.
38
For the Fiscal Year Ended
(in millions)
Included in Amortization Included in Cost of sales
March 3,
2012
February 26,
2012 Chan
g
e
March 3,
2012
February 26,
2012 Chan
g
e
Property, plant and equipment
$359 $272 $87 $301 $225 $76
Intan
g
ible assets
208 166 42 651
264
387
Total
$567 $438 $129 $952 $489 $463