Blackberry 2013 Annual Report Download - page 135
Download and view the complete annual report
Please find page 135 of the 2013 Blackberry annual report below. You can navigate through the pages in the report by either clicking on the pages listed below, or by using the keyword search tool below to find specific information within the annual report.-
 1
1 -
2
-
3
-
4
-
5
-
6
-
7
-
8
-
9
-
10
-
11
-
12
-
13
-
14
-
15
-
16
-
17
-
18
-
19
-
20
-
21
-
22
-
23
-
24
-
25
-
26
-
27
-
28
-
29
-
30
-
31
-
32
-
33
-
34
-
35
-
36
-
37
-
38
-
39
-
40
-
41
-
42
-
43
-
44
-
45
-
46
-
47
-
48
-
49
-
50
-
51
-
52
-
53
-
54
-
55
-
56
-
57
-
58
-
59
-
60
-
61
-
62
-
63
-
64
-
65
-
66
-
67
-
68
-
69
-
70
-
71
-
72
-
73
-
74
-
75
-
76
-
77
-
78
-
79
-
80
-
81
-
82
-
83
-
84
-
85
-
86
-
87
-
88
-
89
-
90
-
91
-
92
-
93
-
94
-
95
-
96
-
97
-
98
-
99
-
100
-
101
-
102
-
103
-
104
-
105
-
106
-
107
-
108
-
109
-
110
-
111
-
112
-
113
-
114
-
115
-
116
-
117
-
118
-
119
-
120
-
121
-
122
-
123
-
124
-
 125
125 -
 126
126 -
 127
127 -
 128
128 -
 129
129 -
 130
130 -
 131
131 -
 132
132 -
 133
133 -
 134
134 -
 135
135 -
 136
136 -
 137
137 -
 138
138 -
 139
139 -
 140
140 -
 141
141 -
 142
142 -
 143
143 -
 144
144 -
 145
145 -
146
-
147
-
148
-
149
-
150
-
151
-
152
-
153
-
154
-
155
-
156
-
157
-
158
-
159
-
160
-
161
-
162
-
163
-
164
-
165
-
166
-
167
-
168
-
169
-
170
-
171
-
172
-
173
-
174
-
175
-
176
-
177
-
178
-
179
-
180
-
181
-
182
-
183
-
184
-
185
-
186
-
187
-
188
-
189
-
190
-
191
-
192
-
193
-
194
-
195
-
196
-
197
-
198
-
199
-
200
-
201
-
202
-
203
-
204
-
205
-
206
-
207
-
208
-
209
-
210
-
211
-
212
-
213
-
214
-
215
-
216
-
217
-
218
-
219
-
220
-
221
-
222
-
223
-
224
-
225
-
226
-
227
-
228
-
229
-
230
-
231
-
232
-
233
-
234
-
235
 |
 |

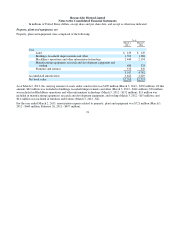
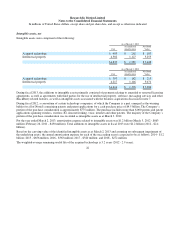
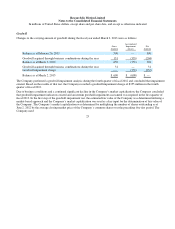
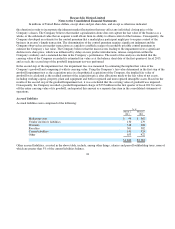
Research In Motion Limited
Notes to the Consolidated Financial Statements
In millions of United States dollars, except share and per share data, and except as otherwise indicated
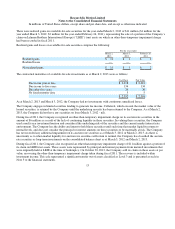
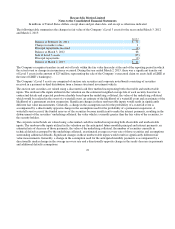
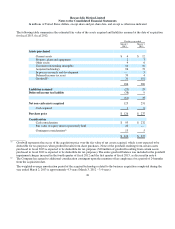
The following table summarizes the changes in fair value of the Company’s Level 3 assets for the years ended March 3, 2012
and March 2, 2013:
The Company recognizes transfers in and out of levels within the fair value hierarchy at the end of the reporting period in which
the actual event or change in circumstance occurred. During the year ended March 2, 2013, there was a significant transfer out
of Level 3 assets in the amount of $25 million, representing the sale of the Company’s unsecured claim on assets held at LBIE at
the time of LBIE’s bankruptcy.
The Company’s Level 3 assets are comprised of auction rate securities and corporate notes/bonds consisting of securities
received in a payment-in-kind distribution from a former structured investment vehicle.
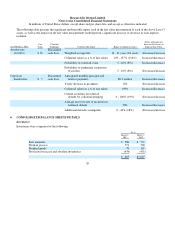
The auction rate securities are valued using a discounted cash flow method incorporating both observable and unobservable
inputs. The unobservable inputs utilized in the valuation are the estimated weighted-average life of each security based on its
contractual details and expected paydown schedule based upon the underlying collateral, the value of the underlying collateral
which would be realized in the event of a waterfall event, an estimate of the likelihood of a waterfall event and an estimate of the
likelihood of a permanent auction suspension. Significant changes in these unobservable inputs would result in significantly
different fair value measurements. Generally, a change in the assumption used for the probability of a waterfall event is
accompanied by a directionally opposite change in the assumption used for the probability of a permanent suspension. A
waterfall event occurs if the funded reserves of the securities become insufficient to make the interest payments, resulting in the
disbursement of the securities’ underlying collateral, the value which is currently greater than the fair value of the securities, to
the security holders.
The corporate notes/bonds are valued using a discounted cash flow method incorporating both observable and unobservable
inputs. The unobservable inputs utilized in the valuation are the anticipated future monthly principal and interest payments, an
estimated rate of decrease of those payments, the value of the underlying collateral, the number of securities currently in
technical default as grouped by the underlying collateral, an estimated average recovery rate of those securities and assumptions
surrounding additional defaults. Significant changes in these unobservable inputs would result in significantly different fair
value measurements. Generally, a change in the assumption used for the anticipated monthly payments is accompanied by a
directionally similar change in the average recovery rate and a directionally opposite change in the yearly decrease in payments
and additional defaults assumptions.
19
Level 3
Balance at February 26, 2011
$71
Chan
g
e in market values
1
Princi
p
al re
p
a
y
ments received
(4)
Balance at March 3, 2012
68
Sale of Level 3 assets (25)
Princi
p
al re
p
a
y
ments (2)
Balance at March 2, 2013
$41