Blackberry 2013 Annual Report Download - page 147
Download and view the complete annual report
Please find page 147 of the 2013 Blackberry annual report below. You can navigate through the pages in the report by either clicking on the pages listed below, or by using the keyword search tool below to find specific information within the annual report.-
 1
1 -
2
-
3
-
4
-
5
-
6
-
7
-
8
-
9
-
10
-
11
-
12
-
13
-
14
-
15
-
16
-
17
-
18
-
19
-
20
-
21
-
22
-
23
-
24
-
25
-
26
-
27
-
28
-
29
-
30
-
31
-
32
-
33
-
34
-
35
-
36
-
37
-
38
-
39
-
40
-
41
-
42
-
43
-
44
-
45
-
46
-
47
-
48
-
49
-
50
-
51
-
52
-
53
-
54
-
55
-
56
-
57
-
58
-
59
-
60
-
61
-
62
-
63
-
64
-
65
-
66
-
67
-
68
-
69
-
70
-
71
-
72
-
73
-
74
-
75
-
76
-
77
-
78
-
79
-
80
-
81
-
82
-
83
-
84
-
85
-
86
-
87
-
88
-
89
-
90
-
91
-
92
-
93
-
94
-
95
-
96
-
97
-
98
-
99
-
100
-
101
-
102
-
103
-
104
-
105
-
106
-
107
-
108
-
109
-
110
-
111
-
112
-
113
-
114
-
115
-
116
-
117
-
118
-
119
-
120
-
121
-
122
-
123
-
124
-
125
-
126
-
127
-
128
-
129
-
130
-
131
-
132
-
133
-
134
-
135
-
136
-
 137
137 -
 138
138 -
 139
139 -
 140
140 -
 141
141 -
 142
142 -
 143
143 -
 144
144 -
 145
145 -
 146
146 -
 147
147 -
 148
148 -
 149
149 -
 150
150 -
 151
151 -
 152
152 -
 153
153 -
 154
154 -
 155
155 -
 156
156 -
 157
157 -
158
-
159
-
160
-
161
-
162
-
163
-
164
-
165
-
166
-
167
-
168
-
169
-
170
-
171
-
172
-
173
-
174
-
175
-
176
-
177
-
178
-
179
-
180
-
181
-
182
-
183
-
184
-
185
-
186
-
187
-
188
-
189
-
190
-
191
-
192
-
193
-
194
-
195
-
196
-
197
-
198
-
199
-
200
-
201
-
202
-
203
-
204
-
205
-
206
-
207
-
208
-
209
-
210
-
211
-
212
-
213
-
214
-
215
-
216
-
217
-
218
-
219
-
220
-
221
-
222
-
223
-
224
-
225
-
226
-
227
-
228
-
229
-
230
-
231
-
232
-
233
-
234
-
235
 |
 |

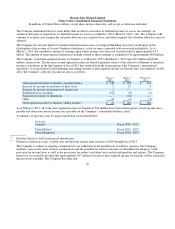
Research In Motion Limited
Notes to the Consolidated Financial Statements
In millions of United States dollars, except share and per share data, and except as otherwise indicated
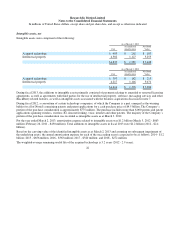
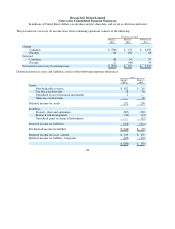
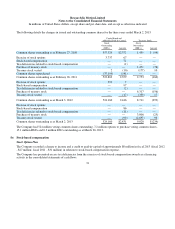
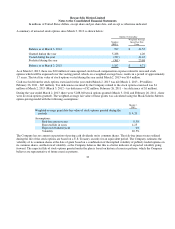
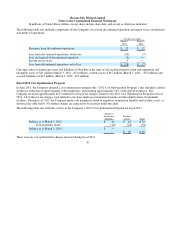
The following details the changes in issued and outstanding common shares for the three years ended March 2, 2013:
The Company had 524 million voting common shares outstanding, 7.2 million options to purchase voting common shares,
15.1 million RSUs and 0.3 million DSUs outstanding as at March 26, 2013.
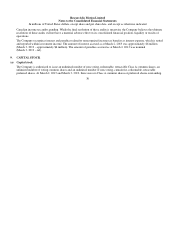
Stock Option Plan
The Company recorded a charge to income and a credit to paid-in-capital of approximately $8 million in fiscal 2013 (fiscal 2012
- $27 million; fiscal 2011 - $31 million) in relation to stock-based compensation expense.
The Company has presented excess tax deficiencies from the exercise of stock-based compensation awards as a financing
activity in the consolidated statements of cash flows.
31
Capital Stock and
Additional Paid-In Capital Treasury Stock
Stock
Outstanding
(000’s) Amount
Stock
Outstanding
(000’s) Amount
Common shares outstandin
g
as at Februar
y
27, 2010
557,329 $2,372 1,459 $(94)
Exercise of stock o
p
tions
3,737 67
—
—
Stoc
k
-based com
p
ensation
—
72
—
—
Tax deficiencies related to stoc
k
-based com
p
ensation
—
(1)
—
—
Purchase of treasur
y
stoc
k
—
—
1,471 (76)
Treasur
y
stock vested
2
(10) (177)
10
Common shares re
p
urchased
(37,199) (141)
—
—
Common shares outstandin
g
as at Februar
y
26, 2011
523,869 2,359 2,753
(160)
Exercise of stock o
p
tions
291 9
—
—
Stoc
k
-based com
p
ensation
—
97
—
—
Tax deficiencies related to stoc
k
-based com
p
ensation
—
(2)
—
—
Purchase of treasur
y
stoc
k
—
—
6,317
(156)
Treasur
y
stock vested
—
(17) (359) 17
Common shares outstandin
g
as at March 3, 2012
524,160 2,446 8,711
(299)
Exercise of stock o
p
tions
—
—
—
—
Stoc
k
-based com
p
ensation
—
86
—
—
Tax deficiencies related to stoc
k
-based com
p
ensation
—
(11)
—
—
Purchase of treasur
y
stoc
k
—
—
3,006
(25)
Treasur
y
stock vested
—
(90) (2,697) 90
Common shares outstandin
g
as at March 2, 2013
524,160 $2,431 9,02
0
$ (234)
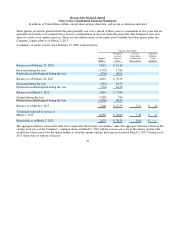
(b) Stock-based compensation