Blackberry 2013 Annual Report Download - page 204
Download and view the complete annual report
Please find page 204 of the 2013 Blackberry annual report below. You can navigate through the pages in the report by either clicking on the pages listed below, or by using the keyword search tool below to find specific information within the annual report.-
 1
1 -
2
-
3
-
4
-
5
-
6
-
7
-
8
-
9
-
10
-
11
-
12
-
13
-
14
-
15
-
16
-
17
-
18
-
19
-
20
-
21
-
22
-
23
-
24
-
25
-
26
-
27
-
28
-
29
-
30
-
31
-
32
-
33
-
34
-
35
-
36
-
37
-
38
-
39
-
40
-
41
-
42
-
43
-
44
-
45
-
46
-
47
-
48
-
49
-
50
-
51
-
52
-
53
-
54
-
55
-
56
-
57
-
58
-
59
-
60
-
61
-
62
-
63
-
64
-
65
-
66
-
67
-
68
-
69
-
70
-
71
-
72
-
73
-
74
-
75
-
76
-
77
-
78
-
79
-
80
-
81
-
82
-
83
-
84
-
85
-
86
-
87
-
88
-
89
-
90
-
91
-
92
-
93
-
94
-
95
-
96
-
97
-
98
-
99
-
100
-
101
-
102
-
103
-
104
-
105
-
106
-
107
-
108
-
109
-
110
-
111
-
112
-
113
-
114
-
115
-
116
-
117
-
118
-
119
-
120
-
121
-
122
-
123
-
124
-
125
-
126
-
127
-
128
-
129
-
130
-
131
-
132
-
133
-
134
-
135
-
136
-
137
-
138
-
139
-
140
-
141
-
142
-
143
-
144
-
145
-
146
-
147
-
148
-
149
-
150
-
151
-
152
-
153
-
154
-
155
-
156
-
157
-
158
-
159
-
160
-
161
-
162
-
163
-
164
-
165
-
166
-
167
-
168
-
169
-
170
-
171
-
172
-
173
-
174
-
175
-
176
-
177
-
178
-
179
-
180
-
181
-
182
-
183
-
184
-
185
-
186
-
187
-
188
-
189
-
190
-
191
-
192
-
193
-
 194
194 -
 195
195 -
 196
196 -
 197
197 -
 198
198 -
 199
199 -
 200
200 -
 201
201 -
 202
202 -
 203
203 -
 204
204 -
 205
205 -
 206
206 -
 207
207 -
 208
208 -
 209
209 -
 210
210 -
 211
211 -
 212
212 -
 213
213 -
 214
214 -
215
-
216
-
217
-
218
-
219
-
220
-
221
-
222
-
223
-
224
-
225
-
226
-
227
-
228
-
229
-
230
-
231
-
232
-
233
-
234
-
235
 |
 |

Research In Motion Limited
Management’s Discussion and Analysis of Financial Condition and Results of Operations
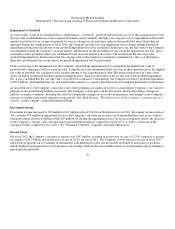
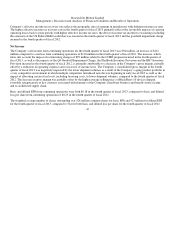
Impairment of Goodwill
As stated under “Critical Accounting Policies and Estimates – Goodwill”, goodwill represents the excess of the acquisition price over
the fair value of identifiable net assets acquired. Goodwill is tested annually, through a two step process, for impairment in the fourth
quarter of each fiscal year, or more frequently if events or changes in circumstances indicate that goodwill is more likely than not
impaired. During the fourth quarter of fiscal 2012, the Company used the two-step impairment test to identify potential goodwill
impairment and measure the amount of the goodwill impairment loss to be recognized. In the first step, the fair value of the Company
was determined using the Company’s average market capitalization for the preceding five days from the impairment test date, plus a
reasonable control premium, which was established based on recent market transactions. The results from the first step of the
goodwill impairment test demonstrated that the carrying value of the Company exceeded its estimated fair value as at the balance
sheet date and therefore the second step of the goodwill impairment test was performed.
In the second step of the impairment test, the Company calculated the impairment loss by estimating the implied fair value of
goodwill and comparing it with its carrying value. Using the fair value determined in the first step as the acquisition price, the implied
fair value of goodwill was calculated as the residual amount of the acquisition price after allocations made to the fair value of net
assets, including recognized and unrecognized intangible assets. Based on the results of the second step of the goodwill impairment
test, it was concluded that the carrying value of goodwill was impaired. Consequently, the Company recorded a goodwill impairment
of $355 million, $346 million after tax, and reported this amount as a separate line item in the Consolidated Statements of Operations.
As described above, the Company’s share price and control premium are significant factors in assessing the Company’s fair value for
purposes of the goodwill impairment assessment. The Company’s share price can be affected by, among other things, changes in
industry or market conditions, including the effect of competition, changes in our results of operations, and changes in the Company’s
forecasts or market expectations relating to future results. See “Risk Factors – The market price of the Company’s common shares is
volatile” in the Company’s Annual Information Form.
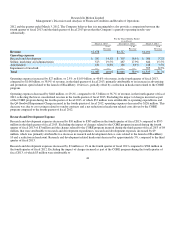
Investment Income
Investment income increased by $13 million to $21 million in fiscal 2012 from $8 million in fiscal 2011. Investment income in fiscal
2011 includes $17 million in impairment losses on the Company’s auction rate securities and Lehman Brothers trust assets, without
which investment income would have been $25 million. Excluding the impairment losses, the decrease primarily reflects the decrease
in the Company’s average cash, cash equivalents and investment balances compared to fiscal 2011, as well as a decrease in the
average yield due compared to fiscal 2011. See “Financial Condition - Liquidity and Capital Resources”.
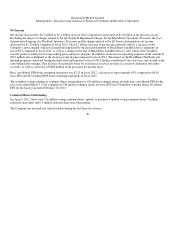
Income Taxes
For fiscal 2012, the Company’s income tax expense was $347 million, resulting in an effective tax rate of 22.9% compared to income
tax expense of $1.2 billion and an effective tax rate of 26.6% for fiscal 2011. The Company’s lower effective tax rate in fiscal 2012
reflects the geographic mix of earnings in jurisdictions with different tax rates, the favourable resolution of uncertain tax positions,
and the higher proportional effect of tax incentives on earnings offset by the unfavourable impact of an impairment charge relating to
non-deductible goodwill.
39