Blackberry 2013 Annual Report Download - page 114
Download and view the complete annual report
Please find page 114 of the 2013 Blackberry annual report below. You can navigate through the pages in the report by either clicking on the pages listed below, or by using the keyword search tool below to find specific information within the annual report.-
 1
1 -
2
-
3
-
4
-
5
-
6
-
7
-
8
-
9
-
10
-
11
-
12
-
13
-
14
-
15
-
16
-
17
-
18
-
19
-
20
-
21
-
22
-
23
-
24
-
25
-
26
-
27
-
28
-
29
-
30
-
31
-
32
-
33
-
34
-
35
-
36
-
37
-
38
-
39
-
40
-
41
-
42
-
43
-
44
-
45
-
46
-
47
-
48
-
49
-
50
-
51
-
52
-
53
-
54
-
55
-
56
-
57
-
58
-
59
-
60
-
61
-
62
-
63
-
64
-
65
-
66
-
67
-
68
-
69
-
70
-
71
-
72
-
73
-
74
-
75
-
76
-
77
-
78
-
79
-
80
-
81
-
82
-
83
-
84
-
85
-
86
-
87
-
88
-
89
-
90
-
91
-
92
-
93
-
94
-
95
-
96
-
97
-
98
-
99
-
100
-
101
-
102
-
103
-
 104
104 -
 105
105 -
 106
106 -
 107
107 -
 108
108 -
 109
109 -
 110
110 -
 111
111 -
 112
112 -
 113
113 -
 114
114 -
 115
115 -
 116
116 -
 117
117 -
 118
118 -
 119
119 -
 120
120 -
 121
121 -
 122
122 -
 123
123 -
 124
124 -
125
-
126
-
127
-
128
-
129
-
130
-
131
-
132
-
133
-
134
-
135
-
136
-
137
-
138
-
139
-
140
-
141
-
142
-
143
-
144
-
145
-
146
-
147
-
148
-
149
-
150
-
151
-
152
-
153
-
154
-
155
-
156
-
157
-
158
-
159
-
160
-
161
-
162
-
163
-
164
-
165
-
166
-
167
-
168
-
169
-
170
-
171
-
172
-
173
-
174
-
175
-
176
-
177
-
178
-
179
-
180
-
181
-
182
-
183
-
184
-
185
-
186
-
187
-
188
-
189
-
190
-
191
-
192
-
193
-
194
-
195
-
196
-
197
-
198
-
199
-
200
-
201
-
202
-
203
-
204
-
205
-
206
-
207
-
208
-
209
-
210
-
211
-
212
-
213
-
214
-
215
-
216
-
217
-
218
-
219
-
220
-
221
-
222
-
223
-
224
-
225
-
226
-
227
-
228
-
229
-
230
-
231
-
232
-
233
-
234
-
235
 |
 |
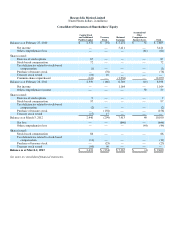
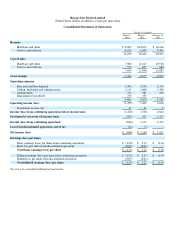
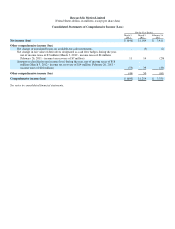
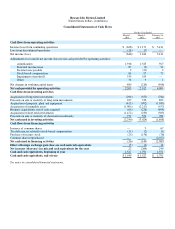
Research In Motion Limited
(United States dollars, in millions, except per share data)
Consolidated Statements of Operations
See notes to consolidated financial statements.
For the Year Ende
d
March 2,
2013
March 3,
2012
February 26,
2011
Revenue
Hardware and other
$ 6,902 $14,031 $ 16,416
Service and software
4,171 4,392 3,491
11,073 18,423
19,907
Cost of sales
Hardware and other
7,060 11,217
10,516
Service and software
579 631 566
7,639 11,848
11,082
Gross margin
3,434 6,575 8,825
Operating expenses
Research and develo
p
ment
1,509 1,556 1,351
Sellin
g
, marketin
g
and administration 2,111 2,60
0
2,400
Amortization
714 567 438
Im
p
airment of
g
oodwill
335 355
-
4,669 5,078 4,189
Operating income (loss)
(1,235) 1,497
4,636
Investment income, net
15 21 8
Income (loss) from continuing operations before income taxes (1,220) 1,518
4,644
Provision for (recovery of) income taxes (592) 347 1,233
Income (loss) from continuing operations (628) 1,171
3,411
Loss from discontinued operations, net of tax
(18) (7) -
Net income (loss)
$ (646) $ 1,164 $3,411
Earnings (loss) per share
Basic earnin
g
s (loss)
p
er share from continuin
g
o
p
erations $ (1.20) $2.23 $6.36
Basic loss
p
er share from discontinued o
p
erations
(0.03) (0.01) -
Total basic earnings (loss) per share $ (1.23) $2.22 $6.36
Diluted earnin
g
s (loss)
p
er share from continuin
g
o
p
erations $(1.20) $2.23 $6.34
Diluted loss
p
er share from discontinued o
p
erations
(0.03) (0.01)
-
Total diluted earnings (loss) per share
$(1.23) $2.22 $6.34