Blackberry 2013 Annual Report Download - page 206
Download and view the complete annual report
Please find page 206 of the 2013 Blackberry annual report below. You can navigate through the pages in the report by either clicking on the pages listed below, or by using the keyword search tool below to find specific information within the annual report.-
 1
1 -
2
-
3
-
4
-
5
-
6
-
7
-
8
-
9
-
10
-
11
-
12
-
13
-
14
-
15
-
16
-
17
-
18
-
19
-
20
-
21
-
22
-
23
-
24
-
25
-
26
-
27
-
28
-
29
-
30
-
31
-
32
-
33
-
34
-
35
-
36
-
37
-
38
-
39
-
40
-
41
-
42
-
43
-
44
-
45
-
46
-
47
-
48
-
49
-
50
-
51
-
52
-
53
-
54
-
55
-
56
-
57
-
58
-
59
-
60
-
61
-
62
-
63
-
64
-
65
-
66
-
67
-
68
-
69
-
70
-
71
-
72
-
73
-
74
-
75
-
76
-
77
-
78
-
79
-
80
-
81
-
82
-
83
-
84
-
85
-
86
-
87
-
88
-
89
-
90
-
91
-
92
-
93
-
94
-
95
-
96
-
97
-
98
-
99
-
100
-
101
-
102
-
103
-
104
-
105
-
106
-
107
-
108
-
109
-
110
-
111
-
112
-
113
-
114
-
115
-
116
-
117
-
118
-
119
-
120
-
121
-
122
-
123
-
124
-
125
-
126
-
127
-
128
-
129
-
130
-
131
-
132
-
133
-
134
-
135
-
136
-
137
-
138
-
139
-
140
-
141
-
142
-
143
-
144
-
145
-
146
-
147
-
148
-
149
-
150
-
151
-
152
-
153
-
154
-
155
-
156
-
157
-
158
-
159
-
160
-
161
-
162
-
163
-
164
-
165
-
166
-
167
-
168
-
169
-
170
-
171
-
172
-
173
-
174
-
175
-
176
-
177
-
178
-
179
-
180
-
181
-
182
-
183
-
184
-
185
-
186
-
187
-
188
-
189
-
190
-
191
-
192
-
193
-
194
-
195
-
 196
196 -
 197
197 -
 198
198 -
 199
199 -
 200
200 -
 201
201 -
 202
202 -
 203
203 -
 204
204 -
 205
205 -
 206
206 -
 207
207 -
 208
208 -
 209
209 -
 210
210 -
 211
211 -
 212
212 -
 213
213 -
 214
214 -
 215
215 -
 216
216 -
217
-
218
-
219
-
220
-
221
-
222
-
223
-
224
-
225
-
226
-
227
-
228
-
229
-
230
-
231
-
232
-
233
-
234
-
235
 |
 |

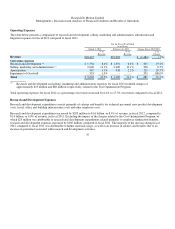
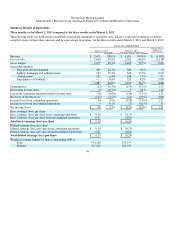
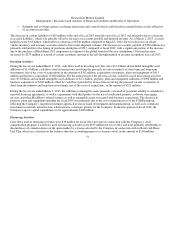
Research In Motion Limited
Management’s Discussion and Analysis of Financial Condition and Results of Operations
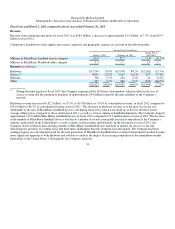
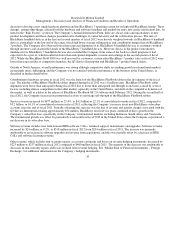
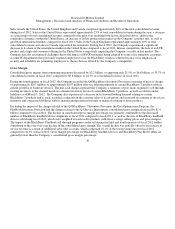
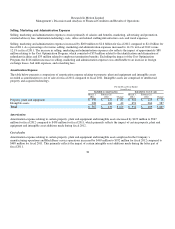
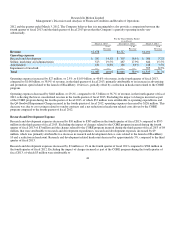
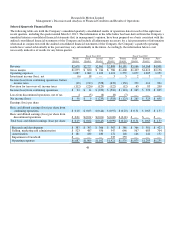
Summary Results of Operations
Three months ended March 2, 2013 compared to the three months ended March 3, 2012
The following table sets forth certain unaudited consolidated statement of operations data, which is expressed in millions of dollars,
except for share and per share amounts and as a percentage of revenue, for the three months ended March 2, 2013 and March 3, 2012:
41
For the Three Months Ended
March 2, 2013 March 3, 2012
Change Fiscal
2013/2012
(in million, except for share and per share amounts)
Revenue
$2,678 100.
0
% $4,181 100.0% $(1,503)
Cost of sales
1,603 59.9% 2,781 66.5%
(1,178)
Gross mar
g
in
1,075 40.1% 1,40
0
33.5% (325)
O
p
eratin
g
ex
p
enses
Research and develo
p
ment
383 14.3% 386 9.2% (3)
Sellin
g
, marketin
g
and administration 523 19.5% 646
15.5%
(123)
Amortization
181 6.8% 148 3.5% 33
Im
p
airment of Goodwill
—
0.0% 355 8.5%
(355)
1,087 40.6% 1,535 36.7% (448)
O
p
eratin
g
loss
(12) (0.4%) (135) (3.2%)
123
Investment income (loss)
(6) (0.2%) 5 0.1% (11)
Loss from continuin
g
o
p
erations before income taxes
(18) (0.6%) (13
0
) (3.1%)
112
Recover
y
of income taxes
(112) (4.2%) (12) (0.3%) (100)
Income (loss) from continuin
g
o
p
erations 94 3.6% (118) (2.8%)
212
Income (loss) from discontinued o
p
erations 4 0.1% (7) (0.2%) 11
Net income (loss)
$98
3.7% $ (125) (3.0%)
$223
Basic earnin
g
s (loss)
p
er share
Basic earnin
g
s (loss)
p
er share from continuin
g
o
p
erations
$0.18
$ (0.23)
Basic earnin
g
s (loss)
p
er share from discontinued o
p
erations
0.01 (0.01)
Total basic earnings (loss) per share
$0.19
$ (0.24)
Diluted earnin
g
s (loss)
p
er share
Diluted earnin
g
s (loss)
p
er share from continuin
g
o
p
erations
$0.18
$ (0.23)
Diluted earnin
g
s (loss)
p
er share from discontinued o
p
erations 0.01 (0.01)
Total diluted earnings (loss) per share $0.19
$ (0.24)
Wei
g
hted-avera
g
e number of shares outstandin
g
(00
0
’s)
Basic
524,16
0
524,139
Diluted
527,222 524,139