Blackberry 2013 Annual Report Download - page 190
Download and view the complete annual report
Please find page 190 of the 2013 Blackberry annual report below. You can navigate through the pages in the report by either clicking on the pages listed below, or by using the keyword search tool below to find specific information within the annual report.-
 1
1 -
2
-
3
-
4
-
5
-
6
-
7
-
8
-
9
-
10
-
11
-
12
-
13
-
14
-
15
-
16
-
17
-
18
-
19
-
20
-
21
-
22
-
23
-
24
-
25
-
26
-
27
-
28
-
29
-
30
-
31
-
32
-
33
-
34
-
35
-
36
-
37
-
38
-
39
-
40
-
41
-
42
-
43
-
44
-
45
-
46
-
47
-
48
-
49
-
50
-
51
-
52
-
53
-
54
-
55
-
56
-
57
-
58
-
59
-
60
-
61
-
62
-
63
-
64
-
65
-
66
-
67
-
68
-
69
-
70
-
71
-
72
-
73
-
74
-
75
-
76
-
77
-
78
-
79
-
80
-
81
-
82
-
83
-
84
-
85
-
86
-
87
-
88
-
89
-
90
-
91
-
92
-
93
-
94
-
95
-
96
-
97
-
98
-
99
-
100
-
101
-
102
-
103
-
104
-
105
-
106
-
107
-
108
-
109
-
110
-
111
-
112
-
113
-
114
-
115
-
116
-
117
-
118
-
119
-
120
-
121
-
122
-
123
-
124
-
125
-
126
-
127
-
128
-
129
-
130
-
131
-
132
-
133
-
134
-
135
-
136
-
137
-
138
-
139
-
140
-
141
-
142
-
143
-
144
-
145
-
146
-
147
-
148
-
149
-
150
-
151
-
152
-
153
-
154
-
155
-
156
-
157
-
158
-
159
-
160
-
161
-
162
-
163
-
164
-
165
-
166
-
167
-
168
-
169
-
170
-
171
-
172
-
173
-
174
-
175
-
176
-
177
-
178
-
179
-
 180
180 -
 181
181 -
 182
182 -
 183
183 -
 184
184 -
 185
185 -
 186
186 -
 187
187 -
 188
188 -
 189
189 -
 190
190 -
 191
191 -
 192
192 -
 193
193 -
 194
194 -
 195
195 -
 196
196 -
 197
197 -
 198
198 -
 199
199 -
 200
200 -
201
-
202
-
203
-
204
-
205
-
206
-
207
-
208
-
209
-
210
-
211
-
212
-
213
-
214
-
215
-
216
-
217
-
218
-
219
-
220
-
221
-
222
-
223
-
224
-
225
-
226
-
227
-
228
-
229
-
230
-
231
-
232
-
233
-
234
-
235
 |
 |

Research In Motion Limited
Management’s Discussion and Analysis of Financial Condition and Results of Operations
the amount being reclassified is required under U.S. GAAP to be reclassified in its entirety to net income. For other amounts that are
not required under U.S. GAAP to be reclassified in their entirety to net income in the same reporting period, an entity is required to
cross-reference other disclosures required under U.S. GAAP that provide additional detail about those amounts. The new authoritative
guidance will become effective for annual and interim reporting periods beginning on or after December 15, 2012, with early
adoption permitted. The Company will adopt the guidance in the first quarter of fiscal 2014 and is currently evaluating the impact that
the adoption of this guidance will have on its results of operations, financial condition and disclosures.
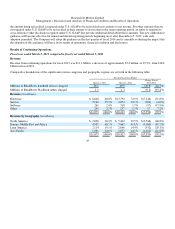
Results of Continuing Operations
Fiscal year ended March 2, 2013 compared to fiscal year ended March 3, 2012
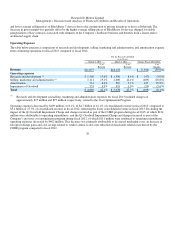
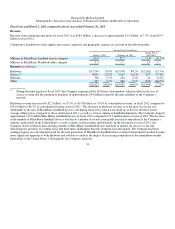
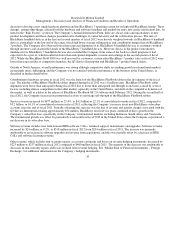
Revenue
Revenue from continuing operations for fiscal 2013 was $11.1 billion, a decrease of approximately $7.4 billion, or 39.9%, from $18.4
billion in fiscal 2012.
Comparative breakdowns of the significant revenue categories and geographic regions are set forth in the following table:
25
For the Fiscal Year Ended
March 2, 2013 March 3, 2012
Change Fiscal
2013/2012
Millions of BlackBerry handheld devices shipped
28.1 49.0 (20.9) (42.7%)
Millions of BlackBerr
y
Pla
y
Book tablets shi
pp
ed
1.1 1.3 (0.2)
(15.4%)
Revenue (in millions)
Hardware
$ 6,648 60.0% $13,794 74.9%
$(7,146) (51.8%)
Service
3,910 35.3% 4,074 22.1% (164) (4.0%)
Software
261 2.4% 318
1.7%
(57) (17.9%)
Other
254 2.3% 237 1.3% 17 7.2%
$11,073 100.0% $18,423
100.0% $(7,35
0
) (39.9%)
Revenue by Geography (in millions)
North America
$ 2,896 26.2% $ 5,442
29.5%
$(2,546) (46.8%)
Euro
p
e, Middle East and Africa
4,502 40.7% 7,662 41.6% (3,16
0
) (41.2%)
Latin America
2,114 19.1% 2,646 14.4%
(532)
(20.1%)
Asia Pacific
1,561 14.0% 2,673 14.5% (1,112) (41.6%)
$11,073 100.0% $18,423 100.0% $(7,35
0
) (39.9%)