Blackberry 2013 Annual Report Download - page 214
Download and view the complete annual report
Please find page 214 of the 2013 Blackberry annual report below. You can navigate through the pages in the report by either clicking on the pages listed below, or by using the keyword search tool below to find specific information within the annual report.-
 1
1 -
2
-
3
-
4
-
5
-
6
-
7
-
8
-
9
-
10
-
11
-
12
-
13
-
14
-
15
-
16
-
17
-
18
-
19
-
20
-
21
-
22
-
23
-
24
-
25
-
26
-
27
-
28
-
29
-
30
-
31
-
32
-
33
-
34
-
35
-
36
-
37
-
38
-
39
-
40
-
41
-
42
-
43
-
44
-
45
-
46
-
47
-
48
-
49
-
50
-
51
-
52
-
53
-
54
-
55
-
56
-
57
-
58
-
59
-
60
-
61
-
62
-
63
-
64
-
65
-
66
-
67
-
68
-
69
-
70
-
71
-
72
-
73
-
74
-
75
-
76
-
77
-
78
-
79
-
80
-
81
-
82
-
83
-
84
-
85
-
86
-
87
-
88
-
89
-
90
-
91
-
92
-
93
-
94
-
95
-
96
-
97
-
98
-
99
-
100
-
101
-
102
-
103
-
104
-
105
-
106
-
107
-
108
-
109
-
110
-
111
-
112
-
113
-
114
-
115
-
116
-
117
-
118
-
119
-
120
-
121
-
122
-
123
-
124
-
125
-
126
-
127
-
128
-
129
-
130
-
131
-
132
-
133
-
134
-
135
-
136
-
137
-
138
-
139
-
140
-
141
-
142
-
143
-
144
-
145
-
146
-
147
-
148
-
149
-
150
-
151
-
152
-
153
-
154
-
155
-
156
-
157
-
158
-
159
-
160
-
161
-
162
-
163
-
164
-
165
-
166
-
167
-
168
-
169
-
170
-
171
-
172
-
173
-
174
-
175
-
176
-
177
-
178
-
179
-
180
-
181
-
182
-
183
-
184
-
185
-
186
-
187
-
188
-
189
-
190
-
191
-
192
-
193
-
194
-
195
-
196
-
197
-
198
-
199
-
200
-
201
-
202
-
203
-
 204
204 -
 205
205 -
 206
206 -
 207
207 -
 208
208 -
 209
209 -
 210
210 -
 211
211 -
 212
212 -
 213
213 -
 214
214 -
 215
215 -
 216
216 -
 217
217 -
 218
218 -
 219
219 -
 220
220 -
 221
221 -
 222
222 -
 223
223 -
 224
224 -
225
-
226
-
227
-
228
-
229
-
230
-
231
-
232
-
233
-
234
-
235
 |
 |

Research In Motion Limited
Management’s Discussion and Analysis of Financial Condition and Results of Operations
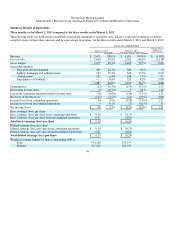
Financial Condition
L
iquidity and Capital Resources
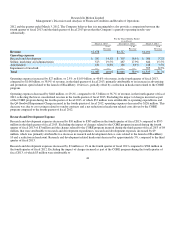
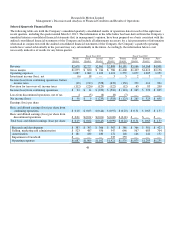
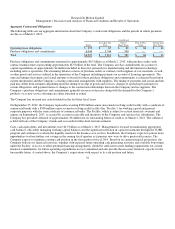
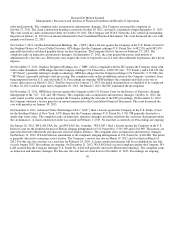
Cash, cash equivalents, and investments increased by $764 million to $2.9 billion as at March 2, 2013 from $2.1 billion as at March 3,
2012. The majority of the Company’s cash, cash equivalents, and investments are denominated in U.S. dollars as at March 2, 2013.
A comparative summary of cash, cash equivalents, and investments is set out below:
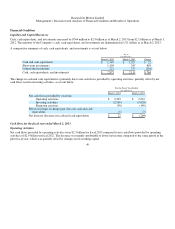
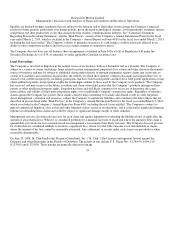
The change in cash and cash equivalents is primarily due to net cash flows provided by operating activities, partially offset by net
cash flows used in investing activities, as set out below:
Cash flows for the fiscal year ended March 2, 2013
Operating Activities
Net cash flows provided by operating activities were $2.3 billion for fiscal 2013 compared to net cash flows provided by operating
activities of $2.9 billion in fiscal 2012. The decrease was mainly attributable to lower net income compared to the same period in the
prior fiscal year, which was partially offset by changes net in working capital.
49
As at
(in millions)
March 2, 2013 March 3, 2012 Change
Cash and cash equivalents
$1,549 $1,527 $22
Short-term investments
1,105 247 858
Lon
g
-term investments
221 337 (116)
Cash, cash e
q
uivalents, and investments
$ 2,875 $ 2,111 $ 764
For the Fiscal Year Ended
(in millions)
March 2, 2013 March 3, 2012
Net cash flows
p
rovided b
y
(used in):
O
p
eratin
g
activities $ 2,303 $ 2,912
Investin
g
activities (2,24
0
) (3,024)
Financin
g
activities (36) (149)
Effect of foreign exchange gain (loss) on cash and cash
e
q
uivalents
(5) (3)
Net increase (decrease) in cash and cash e
q
uivalents $ 22 $ (264)