Blackberry 2013 Annual Report Download - page 118
Download and view the complete annual report
Please find page 118 of the 2013 Blackberry annual report below. You can navigate through the pages in the report by either clicking on the pages listed below, or by using the keyword search tool below to find specific information within the annual report.-
 1
1 -
2
-
3
-
4
-
5
-
6
-
7
-
8
-
9
-
10
-
11
-
12
-
13
-
14
-
15
-
16
-
17
-
18
-
19
-
20
-
21
-
22
-
23
-
24
-
25
-
26
-
27
-
28
-
29
-
30
-
31
-
32
-
33
-
34
-
35
-
36
-
37
-
38
-
39
-
40
-
41
-
42
-
43
-
44
-
45
-
46
-
47
-
48
-
49
-
50
-
51
-
52
-
53
-
54
-
55
-
56
-
57
-
58
-
59
-
60
-
61
-
62
-
63
-
64
-
65
-
66
-
67
-
68
-
69
-
70
-
71
-
72
-
73
-
74
-
75
-
76
-
77
-
78
-
79
-
80
-
81
-
82
-
83
-
84
-
85
-
86
-
87
-
88
-
89
-
90
-
91
-
92
-
93
-
94
-
95
-
96
-
97
-
98
-
99
-
100
-
101
-
102
-
103
-
104
-
105
-
106
-
107
-
 108
108 -
 109
109 -
 110
110 -
 111
111 -
 112
112 -
 113
113 -
 114
114 -
 115
115 -
 116
116 -
 117
117 -
 118
118 -
 119
119 -
 120
120 -
 121
121 -
 122
122 -
 123
123 -
 124
124 -
 125
125 -
 126
126 -
 127
127 -
 128
128 -
129
-
130
-
131
-
132
-
133
-
134
-
135
-
136
-
137
-
138
-
139
-
140
-
141
-
142
-
143
-
144
-
145
-
146
-
147
-
148
-
149
-
150
-
151
-
152
-
153
-
154
-
155
-
156
-
157
-
158
-
159
-
160
-
161
-
162
-
163
-
164
-
165
-
166
-
167
-
168
-
169
-
170
-
171
-
172
-
173
-
174
-
175
-
176
-
177
-
178
-
179
-
180
-
181
-
182
-
183
-
184
-
185
-
186
-
187
-
188
-
189
-
190
-
191
-
192
-
193
-
194
-
195
-
196
-
197
-
198
-
199
-
200
-
201
-
202
-
203
-
204
-
205
-
206
-
207
-
208
-
209
-
210
-
211
-
212
-
213
-
214
-
215
-
216
-
217
-
218
-
219
-
220
-
221
-
222
-
223
-
224
-
225
-
226
-
227
-
228
-
229
-
230
-
231
-
232
-
233
-
234
-
235
 |
 |

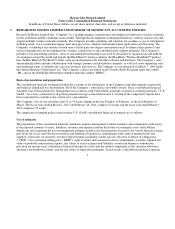
Research In Motion Limited
Notes to the Consolidated Financial Statements
In millions of United States dollars, except share and per share data, and except as otherwise indicated
Foreign currency translation
The U.S. dollar is the functional and reporting currency of the Company. Foreign currency denominated assets and liabilities of
the Company and all of its subsidiaries are translated into U.S. dollars. Accordingly, monetary assets and liabilities are translated
using the exchange rates in effect at the consolidated balance sheet dates and revenues and expenses are translated at the rates of
exchange prevailing when the transactions occurred. Remeasurement adjustments are included in income. Non-monetary assets
and liabilities are translated at historical exchange rates.
Cash and cash equivalents
Cash and cash equivalents consist of balances with banks and liquid investments with maturities of three months or less at the
date of acquisition.
Accounts receivable, net
The accounts receivable balance which reflects invoiced and accrued revenue is presented net of an allowance for doubtful
accounts. The allowance for doubtful accounts reflects estimates of probable losses in accounts receivables. The Company is
dependent on a number of significant customers and on large complex contracts with respect to sales of the majority of its
products, software and services. The Company expects the majority of its accounts receivable balances to continue to come from
large customers as it sells the majority of its devices and software products and service relay access through network carriers and
resellers rather than directly.
The Company evaluates the collectability of its accounts receivables based upon a combination of factors on a periodic basis
such as specific credit risk of its customers, historical trends and economic circumstances. The Company, in the normal course
of business, monitors the financial condition of its customers and reviews the credit history of each new customer. When the
Company becomes aware of a specific customer’s inability to meet its financial obligations to the Company (such as in the case
of bankruptcy filings or material deterioration in the customer’s operating results or financial position, and payment
experiences), the Company records a specific bad debt provision to reduce the customer’s related accounts receivable to its
estimated net realizable value. If circumstances related to specific customers change, the Company’s estimates of the
recoverability of accounts receivables balances could be further adjusted. The allowance for doubtful accounts as at March 2,
2013 is $17 million (March 3, 2012 - $16 million).
While the Company sells its products and services to a variety of customers, there were no customers that comprised more than
10% of the Company’s revenue in fiscal 2013 (March 3, 2012 – no customers that comprised more than 10%; February 26, 2011
– two customers comprised 11% each). There was one customer that comprised 8.2% of accounts receivable as at March 2, 2013
(March 3, 2012 – one customer comprised 13%).
Investments
The Company’s cash equivalents and investments, other than cost method investments of $4 million (March 3, 2012 - $37
million) and equity method investments of $46 million (March 3, 2012 - $48 million), consist of money market and other debt
securities, which are classified as available-for-sale for accounting purposes and are carried at fair value with unrealized gains
and losses net of related income taxes recorded in accumulated other comprehensive income until such investments mature or
are sold. The Company uses the specific identification method of determining the cost basis in computing realized gains or
losses on available-for-sale investments
2