Blackberry 2013 Annual Report Download - page 202
Download and view the complete annual report
Please find page 202 of the 2013 Blackberry annual report below. You can navigate through the pages in the report by either clicking on the pages listed below, or by using the keyword search tool below to find specific information within the annual report.-
 1
1 -
2
-
3
-
4
-
5
-
6
-
7
-
8
-
9
-
10
-
11
-
12
-
13
-
14
-
15
-
16
-
17
-
18
-
19
-
20
-
21
-
22
-
23
-
24
-
25
-
26
-
27
-
28
-
29
-
30
-
31
-
32
-
33
-
34
-
35
-
36
-
37
-
38
-
39
-
40
-
41
-
42
-
43
-
44
-
45
-
46
-
47
-
48
-
49
-
50
-
51
-
52
-
53
-
54
-
55
-
56
-
57
-
58
-
59
-
60
-
61
-
62
-
63
-
64
-
65
-
66
-
67
-
68
-
69
-
70
-
71
-
72
-
73
-
74
-
75
-
76
-
77
-
78
-
79
-
80
-
81
-
82
-
83
-
84
-
85
-
86
-
87
-
88
-
89
-
90
-
91
-
92
-
93
-
94
-
95
-
96
-
97
-
98
-
99
-
100
-
101
-
102
-
103
-
104
-
105
-
106
-
107
-
108
-
109
-
110
-
111
-
112
-
113
-
114
-
115
-
116
-
117
-
118
-
119
-
120
-
121
-
122
-
123
-
124
-
125
-
126
-
127
-
128
-
129
-
130
-
131
-
132
-
133
-
134
-
135
-
136
-
137
-
138
-
139
-
140
-
141
-
142
-
143
-
144
-
145
-
146
-
147
-
148
-
149
-
150
-
151
-
152
-
153
-
154
-
155
-
156
-
157
-
158
-
159
-
160
-
161
-
162
-
163
-
164
-
165
-
166
-
167
-
168
-
169
-
170
-
171
-
172
-
173
-
174
-
175
-
176
-
177
-
178
-
179
-
180
-
181
-
182
-
183
-
184
-
185
-
186
-
187
-
188
-
189
-
190
-
191
-
 192
192 -
 193
193 -
 194
194 -
 195
195 -
 196
196 -
 197
197 -
 198
198 -
 199
199 -
 200
200 -
 201
201 -
 202
202 -
 203
203 -
 204
204 -
 205
205 -
 206
206 -
 207
207 -
 208
208 -
 209
209 -
 210
210 -
 211
211 -
 212
212 -
213
-
214
-
215
-
216
-
217
-
218
-
219
-
220
-
221
-
222
-
223
-
224
-
225
-
226
-
227
-
228
-
229
-
230
-
231
-
232
-
233
-
234
-
235
 |
 |

Research In Motion Limited
Management’s Discussion and Analysis of Financial Condition and Results of Operations
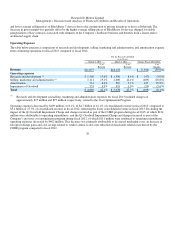
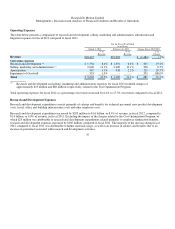
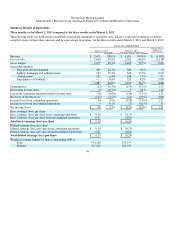
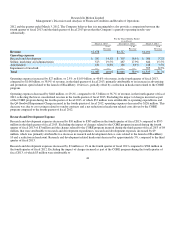
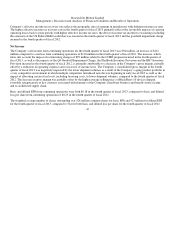
Operating Expenses
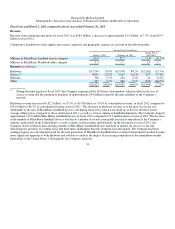
The table below presents a comparison of research and development, selling, marketing and administration, amortization and
litigation expenses for fiscal 2012 compared to fiscal 2011.
Total operating expenses for fiscal 2012 as a percentage of revenue increased by 6.4% to 27.5% of revenue compared to fiscal 2011.
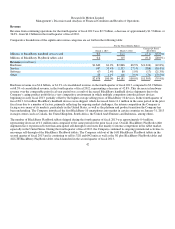
Research and Development Expenses
Research and development expenditures consist primarily of salaries and benefits for technical personnel, new product development
costs, travel, office and building infrastructure costs and other employee costs.
Research and development expenditures increased by $205 million to $1.6 billion, or 8.4% of revenue, in fiscal 2012, compared to
$1.4 billion, or 6.8% of revenue, in fiscal 2011. Excluding the impact of the charges related to the Cost Optimization Program, of
which $23 million was attributable to research and development expenditures related primarily to employee termination benefits,
research and development expenses increased by $185 million compared to fiscal 2011. The majority of the increase during fiscal
2012 compared to fiscal 2011 was attributable to higher materials usage, as well as an increase in salaries and benefits due to an
increase in personnel associated with research and development activities.
37
For the Fiscal Year Ended
(in millions)
March 3, 2012 February 26, 2011 Change Fiscal 2012/2011
% of
Revenue
% of
Revenue
% of
Change
Revenue
$18,423 $19,907 $(1,484) (7%)
Operating expenses
Research and develo
p
ment
$1,556 8.4% $1,351 6.8% $205 15.2%
Sellin
g
, marketin
g
and administration 2,600 14.1% 2,400 12.1% 200
8.3%
Amortization
567 3.1% 438 2.2% 129 29.5%
Im
p
airment of Goodwill
355 1.9% -
- 355
100.0%
Total
$5,078 27.5% $4,189 21.1% $889 21.2%
Research and development and selling, marketing and administration expenses for fiscal 2012 included charges of
a
pp
roximatel
y
$23 million and $88 million, res
p
ectivel
y
, related to the Cost O
p
timization Pro
g
ram.
(1)
(1)
(1)