Blackberry 2013 Annual Report Download - page 133
Download and view the complete annual report
Please find page 133 of the 2013 Blackberry annual report below. You can navigate through the pages in the report by either clicking on the pages listed below, or by using the keyword search tool below to find specific information within the annual report.-
 1
1 -
2
-
3
-
4
-
5
-
6
-
7
-
8
-
9
-
10
-
11
-
12
-
13
-
14
-
15
-
16
-
17
-
18
-
19
-
20
-
21
-
22
-
23
-
24
-
25
-
26
-
27
-
28
-
29
-
30
-
31
-
32
-
33
-
34
-
35
-
36
-
37
-
38
-
39
-
40
-
41
-
42
-
43
-
44
-
45
-
46
-
47
-
48
-
49
-
50
-
51
-
52
-
53
-
54
-
55
-
56
-
57
-
58
-
59
-
60
-
61
-
62
-
63
-
64
-
65
-
66
-
67
-
68
-
69
-
70
-
71
-
72
-
73
-
74
-
75
-
76
-
77
-
78
-
79
-
80
-
81
-
82
-
83
-
84
-
85
-
86
-
87
-
88
-
89
-
90
-
91
-
92
-
93
-
94
-
95
-
96
-
97
-
98
-
99
-
100
-
101
-
102
-
103
-
104
-
105
-
106
-
107
-
108
-
109
-
110
-
111
-
112
-
113
-
114
-
115
-
116
-
117
-
118
-
119
-
120
-
121
-
122
-
 123
123 -
 124
124 -
 125
125 -
 126
126 -
 127
127 -
 128
128 -
 129
129 -
 130
130 -
 131
131 -
 132
132 -
 133
133 -
 134
134 -
 135
135 -
 136
136 -
 137
137 -
 138
138 -
 139
139 -
 140
140 -
 141
141 -
 142
142 -
 143
143 -
144
-
145
-
146
-
147
-
148
-
149
-
150
-
151
-
152
-
153
-
154
-
155
-
156
-
157
-
158
-
159
-
160
-
161
-
162
-
163
-
164
-
165
-
166
-
167
-
168
-
169
-
170
-
171
-
172
-
173
-
174
-
175
-
176
-
177
-
178
-
179
-
180
-
181
-
182
-
183
-
184
-
185
-
186
-
187
-
188
-
189
-
190
-
191
-
192
-
193
-
194
-
195
-
196
-
197
-
198
-
199
-
200
-
201
-
202
-
203
-
204
-
205
-
206
-
207
-
208
-
209
-
210
-
211
-
212
-
213
-
214
-
215
-
216
-
217
-
218
-
219
-
220
-
221
-
222
-
223
-
224
-
225
-
226
-
227
-
228
-
229
-
230
-
231
-
232
-
233
-
234
-
235
 |
 |

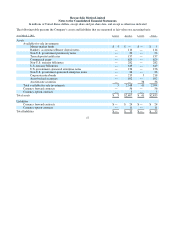
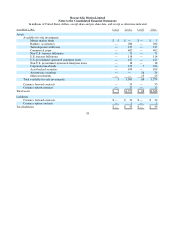
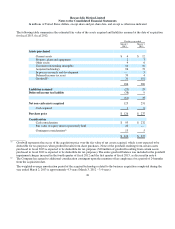
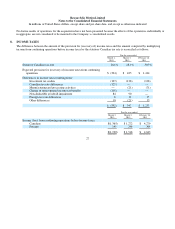
Research In Motion Limited
Notes to the Consolidated Financial Statements
In millions of United States dollars, except share and per share data, and except as otherwise indicated
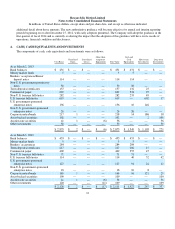
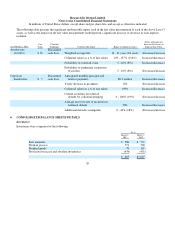
The following table presents the Company’s assets and liabilities that are measured at fair value on a recurring basis:
17
As at March 2, 2013 Level 1 Level 2 Level 3 Total
Assets
Available-for-sale investments
Mone
y
market funds
$ 5 $
—
$
—
$ 5
Bankers’ acce
p
tances/Bearer de
p
osit notes
—
114
—
114
Non-U.S.
g
overnment
p
romissor
y
notes
—
50
—
5
0
Term de
p
osits/certificates
—
157
—
157
Commercial
p
a
p
er
—
629
—
629
Non-U.S. treasur
y
bills/notes
—
282
—
282
U.S. treasur
y
bills/notes
—
619
—
619
U.S.
g
overnment s
p
onsored enter
p
rise notes
—
156
—
156
Non-U.S.
g
overnment s
p
onsored enter
p
rise notes
—
26
—
26
Cor
p
orate notes/bonds
—
213 5
218
Asset-backed securities
—
102
—
102
Auction rate securities
—
—
36
36
Total available-for-sale investments
5 2,348 41 2,394
Currenc
y
forward contracts
—
56
—
56
Currenc
y
o
p
tion contracts
—
3
—
3
Total assets
$5
$2,407 $41 $2,453
Liabilities
Currency forward contracts $
—
$ 24 $
—
$24
Currenc
y
o
p
tion contracts
—
11
—
11
Total liabilities
$
—
$ 35 $
—
$35