Blackberry 2013 Annual Report Download - page 140
Download and view the complete annual report
Please find page 140 of the 2013 Blackberry annual report below. You can navigate through the pages in the report by either clicking on the pages listed below, or by using the keyword search tool below to find specific information within the annual report.-
 1
1 -
2
-
3
-
4
-
5
-
6
-
7
-
8
-
9
-
10
-
11
-
12
-
13
-
14
-
15
-
16
-
17
-
18
-
19
-
20
-
21
-
22
-
23
-
24
-
25
-
26
-
27
-
28
-
29
-
30
-
31
-
32
-
33
-
34
-
35
-
36
-
37
-
38
-
39
-
40
-
41
-
42
-
43
-
44
-
45
-
46
-
47
-
48
-
49
-
50
-
51
-
52
-
53
-
54
-
55
-
56
-
57
-
58
-
59
-
60
-
61
-
62
-
63
-
64
-
65
-
66
-
67
-
68
-
69
-
70
-
71
-
72
-
73
-
74
-
75
-
76
-
77
-
78
-
79
-
80
-
81
-
82
-
83
-
84
-
85
-
86
-
87
-
88
-
89
-
90
-
91
-
92
-
93
-
94
-
95
-
96
-
97
-
98
-
99
-
100
-
101
-
102
-
103
-
104
-
105
-
106
-
107
-
108
-
109
-
110
-
111
-
112
-
113
-
114
-
115
-
116
-
117
-
118
-
119
-
120
-
121
-
122
-
123
-
124
-
125
-
126
-
127
-
128
-
129
-
 130
130 -
 131
131 -
 132
132 -
 133
133 -
 134
134 -
 135
135 -
 136
136 -
 137
137 -
 138
138 -
 139
139 -
 140
140 -
 141
141 -
 142
142 -
 143
143 -
 144
144 -
 145
145 -
 146
146 -
 147
147 -
 148
148 -
 149
149 -
 150
150 -
151
-
152
-
153
-
154
-
155
-
156
-
157
-
158
-
159
-
160
-
161
-
162
-
163
-
164
-
165
-
166
-
167
-
168
-
169
-
170
-
171
-
172
-
173
-
174
-
175
-
176
-
177
-
178
-
179
-
180
-
181
-
182
-
183
-
184
-
185
-
186
-
187
-
188
-
189
-
190
-
191
-
192
-
193
-
194
-
195
-
196
-
197
-
198
-
199
-
200
-
201
-
202
-
203
-
204
-
205
-
206
-
207
-
208
-
209
-
210
-
211
-
212
-
213
-
214
-
215
-
216
-
217
-
218
-
219
-
220
-
221
-
222
-
223
-
224
-
225
-
226
-
227
-
228
-
229
-
230
-
231
-
232
-
233
-
234
-
235
 |
 |

Research In Motion Limited
Notes to the Consolidated Financial Statements
In millions of United States dollars, except share and per share data, and except as otherwise indicated
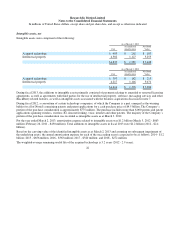
this duration in order to incorporate the inherent market fluctuations that may affect any individual closing price of the
Company’s shares. The Company believes that market capitalization alone does not capture the fair value of the business as a
whole, or the substantial value that an acquirer would obtain from its ability to obtain control of the business. Consequently, the
Company developed an estimate for the control premium that a marketplace participant might pay to acquire control of the
business in an arm’s-length transaction. The determination of the control premium requires significant judgment and the
Company observed recent market transactions as a guide to establish a range of reasonably possible control premiums to
estimate the Company’s fair value. The Company believes that the main factors leading to the impairment were a significant
decline in its share price, which was influenced by delays in new product introductions, intense competition within the
Company’s industry and a sustained decline in the Company’s performance. The result of this analysis concluded that the
carrying value of the Company exceeded its estimated fair value as at the balance sheet date of the first quarter of fiscal 2013,
and as such, the second step of the goodwill impairment test was performed.
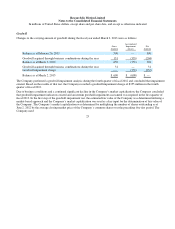
In the second step of the impairment test, the impairment loss was measured by estimating the implied fair value of the
Company’s goodwill and comparing it with its carrying value. Using the Company’s fair value determined in the first step of the
goodwill impairment test as the acquisition price in a hypothetical acquisition of the Company, the implied fair value of
goodwill was calculated as the residual amount of the acquisition price after allocations made to the fair value of net assets,
including working capital, property, plant and equipment and both recognized and unrecognized intangible assets. Based on the
results of the second step of the goodwill impairment test, it was concluded that the carrying value of goodwill was impaired.
Consequently, the Company recorded a goodwill impairment charge of $335 million in the first quarter of fiscal 2013 to write-
off the entire carrying value of its goodwill, and reported this amount as a separate line item in the consolidated statements of
operations.
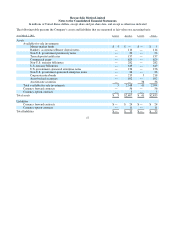
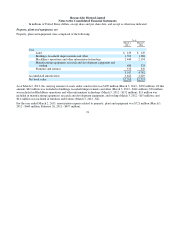
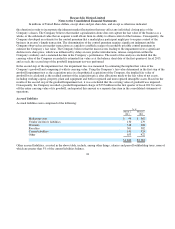
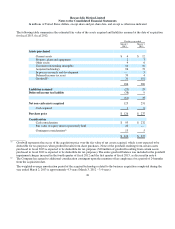
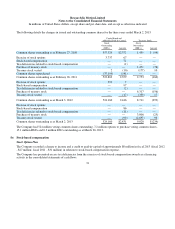
Accrued liabilities
Accrued liabilities were comprised of the following:
Other accrued liabilities, as noted in the above table, include, among other things, salaries and payroll withholding taxes, none o
f
which are greater than 5% of the current liabilities balance.
24
As at
March 2,
2013
March 3,
2012
Marketin
g
costs
$99 $367
Vendor inventor
y
liabilities 130 279
Warrant
y
318 408
Ro
y
alties
501 382
Carrier liabilities
141 524
Other
653 422
$1,842 $2,382