Blackberry 2013 Annual Report Download - page 163
Download and view the complete annual report
Please find page 163 of the 2013 Blackberry annual report below. You can navigate through the pages in the report by either clicking on the pages listed below, or by using the keyword search tool below to find specific information within the annual report.-
 1
1 -
2
-
3
-
4
-
5
-
6
-
7
-
8
-
9
-
10
-
11
-
12
-
13
-
14
-
15
-
16
-
17
-
18
-
19
-
20
-
21
-
22
-
23
-
24
-
25
-
26
-
27
-
28
-
29
-
30
-
31
-
32
-
33
-
34
-
35
-
36
-
37
-
38
-
39
-
40
-
41
-
42
-
43
-
44
-
45
-
46
-
47
-
48
-
49
-
50
-
51
-
52
-
53
-
54
-
55
-
56
-
57
-
58
-
59
-
60
-
61
-
62
-
63
-
64
-
65
-
66
-
67
-
68
-
69
-
70
-
71
-
72
-
73
-
74
-
75
-
76
-
77
-
78
-
79
-
80
-
81
-
82
-
83
-
84
-
85
-
86
-
87
-
88
-
89
-
90
-
91
-
92
-
93
-
94
-
95
-
96
-
97
-
98
-
99
-
100
-
101
-
102
-
103
-
104
-
105
-
106
-
107
-
108
-
109
-
110
-
111
-
112
-
113
-
114
-
115
-
116
-
117
-
118
-
119
-
120
-
121
-
122
-
123
-
124
-
125
-
126
-
127
-
128
-
129
-
130
-
131
-
132
-
133
-
134
-
135
-
136
-
137
-
138
-
139
-
140
-
141
-
142
-
143
-
144
-
145
-
146
-
147
-
148
-
149
-
150
-
151
-
152
-
 153
153 -
 154
154 -
 155
155 -
 156
156 -
 157
157 -
 158
158 -
 159
159 -
 160
160 -
 161
161 -
 162
162 -
 163
163 -
 164
164 -
 165
165 -
 166
166 -
 167
167 -
 168
168 -
 169
169 -
 170
170 -
 171
171 -
 172
172 -
 173
173 -
174
-
175
-
176
-
177
-
178
-
179
-
180
-
181
-
182
-
183
-
184
-
185
-
186
-
187
-
188
-
189
-
190
-
191
-
192
-
193
-
194
-
195
-
196
-
197
-
198
-
199
-
200
-
201
-
202
-
203
-
204
-
205
-
206
-
207
-
208
-
209
-
210
-
211
-
212
-
213
-
214
-
215
-
216
-
217
-
218
-
219
-
220
-
221
-
222
-
223
-
224
-
225
-
226
-
227
-
228
-
229
-
230
-
231
-
232
-
233
-
234
-
235
 |
 |

Research In Motion Limited
Notes to the Consolidated Financial Statements
In millions of United States dollars, except share and per share data, and except as otherwise indicated
The Company is exposed to market and credit risk on its investment portfolio. The Company reduces this risk by investing in
liquid, investment grade securities and by limiting exposure to any one entity or group of related entities. As at March 2, 2013,
no single issuer represented more than 22% of the total cash, cash equivalents and investments (March 3, 2012 - no single issuer
represented more than 9% of the total cash and cash equivalents and investments).
Interest Rate Risk
Cash and cash equivalents and investments are invested in certain instruments of varying maturities. Consequently, the
Company is exposed to interest rate risk as a result of holding investments of varying maturities. The fair value of investments,
as well as the investment income derived from the investment portfolio, will fluctuate with changes in prevailing interest rates.
The Company does not currently utilize interest rate derivative instruments to hedge its investment portfolio.
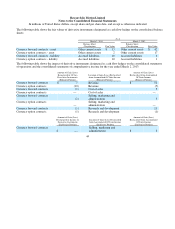
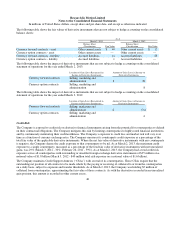
The Company is organized and managed as a single reportable operating segment. The Company currently sells an integrated
BlackBerry wireless communications platform solution, which includes the sale of BlackBerry handheld devices and the
provision of data communication, compression and security infrastructure services, which enable BlackBerry handheld wireless
devices to send and receive wireless messages and data. For enterprise customers, the Company currently sells an integrated
BlackBerry Enterprise Server software solution that gives corporate and government customers the ability to set and enforce
specific information technology policies to manage their BlackBerry handheld wireless devices when the data services pass
through BlackBerry’s Relay and Provisioning infrastructure.
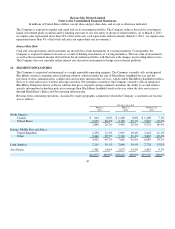
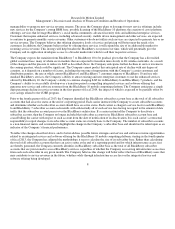
Revenue from continuing operations, classified by major geographic segments in which the Company’s customers are located,
was as follows:
47
16. SEGMENT DISCLOSURES
For the year ended
March 2,
2013
March 3,
2012
February 26,
2011
North America
Canada
$ 661 6.0% $ 1,260
6.8%
$ 1,408 7.1%
United States
2,235 20.2% 4,182 22.7% 7,823 39.3%
2,896 26.2% 5,442
29.5%
9,231
46.4%
Euro
p
e, Middle East and Africa
United Kin
g
dom
1,238 11.2% 1,919 10.4%
2,218
11.1%
Other
3,264 29.5% 5,743 31.2% 3,867 19.4%
4,502 40.7% 7,662
41.6%
6,085
30.5%
Latin America
2,114 19.1% 2,646 14.4% 2,738 13.8%
Asia Pacific
1,561 14.0% 2,673 14.5%
1,853
9.3%
$11,073 100.0% $18,423 100.0% $19,907 100.0%