Blackberry 2013 Annual Report Download - page 136
Download and view the complete annual report
Please find page 136 of the 2013 Blackberry annual report below. You can navigate through the pages in the report by either clicking on the pages listed below, or by using the keyword search tool below to find specific information within the annual report.-
 1
1 -
2
-
3
-
4
-
5
-
6
-
7
-
8
-
9
-
10
-
11
-
12
-
13
-
14
-
15
-
16
-
17
-
18
-
19
-
20
-
21
-
22
-
23
-
24
-
25
-
26
-
27
-
28
-
29
-
30
-
31
-
32
-
33
-
34
-
35
-
36
-
37
-
38
-
39
-
40
-
41
-
42
-
43
-
44
-
45
-
46
-
47
-
48
-
49
-
50
-
51
-
52
-
53
-
54
-
55
-
56
-
57
-
58
-
59
-
60
-
61
-
62
-
63
-
64
-
65
-
66
-
67
-
68
-
69
-
70
-
71
-
72
-
73
-
74
-
75
-
76
-
77
-
78
-
79
-
80
-
81
-
82
-
83
-
84
-
85
-
86
-
87
-
88
-
89
-
90
-
91
-
92
-
93
-
94
-
95
-
96
-
97
-
98
-
99
-
100
-
101
-
102
-
103
-
104
-
105
-
106
-
107
-
108
-
109
-
110
-
111
-
112
-
113
-
114
-
115
-
116
-
117
-
118
-
119
-
120
-
121
-
122
-
123
-
124
-
125
-
 126
126 -
 127
127 -
 128
128 -
 129
129 -
 130
130 -
 131
131 -
 132
132 -
 133
133 -
 134
134 -
 135
135 -
 136
136 -
 137
137 -
 138
138 -
 139
139 -
 140
140 -
 141
141 -
 142
142 -
 143
143 -
 144
144 -
 145
145 -
 146
146 -
147
-
148
-
149
-
150
-
151
-
152
-
153
-
154
-
155
-
156
-
157
-
158
-
159
-
160
-
161
-
162
-
163
-
164
-
165
-
166
-
167
-
168
-
169
-
170
-
171
-
172
-
173
-
174
-
175
-
176
-
177
-
178
-
179
-
180
-
181
-
182
-
183
-
184
-
185
-
186
-
187
-
188
-
189
-
190
-
191
-
192
-
193
-
194
-
195
-
196
-
197
-
198
-
199
-
200
-
201
-
202
-
203
-
204
-
205
-
206
-
207
-
208
-
209
-
210
-
211
-
212
-
213
-
214
-
215
-
216
-
217
-
218
-
219
-
220
-
221
-
222
-
223
-
224
-
225
-
226
-
227
-
228
-
229
-
230
-
231
-
232
-
233
-
234
-
235
 |
 |

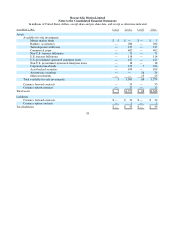
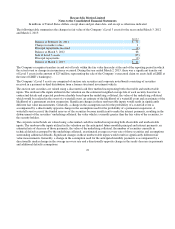
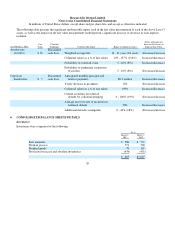
Research In Motion Limited
Notes to the Consolidated Financial Statements
In millions of United States dollars, except share and per share data, and except as otherwise indicated
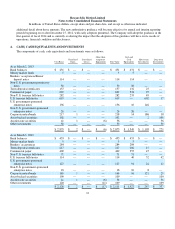
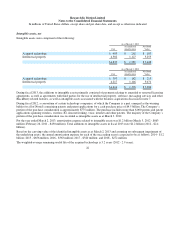
The following table presents the significant unobservable inputs used in the fair value measurement of each of the above Level 3
assets, as well as the impact on the fair value measurement resulting from a significant increase or decrease in each input in
isolation:
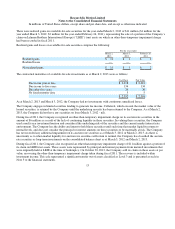
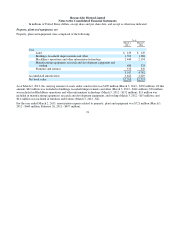
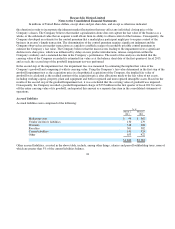
Inventories
Inventories were comprised of the following:
20
As at March 2, 2013
Fair
Value
Valuation
Technique Unobservable Input Range (weighted average)
Effect of Significant
Increase/(Decrease) in
Input on Fair Value
Auction rate
securities
$36
Discounted
cash flow Wei
g
hted-avera
g
e life 10 - 21
y
ears (16
y
ears) (Decrease)/increase
Collateral value (as a % of fair value) 103 - 137% (116%) Increase/(decrease)
Probabilit
y
of waterfall event 5 - 10% (8%) Increase/(decrease)
Probability of permanent suspension
of auction
5 - 10% (8%) (Decrease)/increase
Corporate
bonds/notes
$ 5
Discounted
cash flow
Anticipated monthly principal and
interest
p
a
y
ments $0.2 million Increase/(decrease)
Yearl
y
decrease in
p
a
y
ments 10% (Decrease)/increase
Collateral value (as a % of fair value) 193% Increase/(decrease)
Current securities in technical
default, b
y
collateral
g
rou
p
in
g
0 - 100% (19%) (Decrease)/increase
Average recovery rate of securities in
technical default 30% Increase/(decrease)
Additional defaults assum
p
tion 0 - 44% (18%) (Decrease)/increase
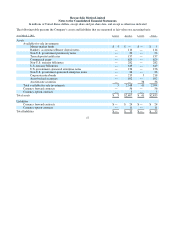
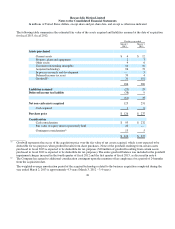
6. CONSOLIDATED BALANCE SHEETS DETAILS
As at
March 2, March 3,
2013 2012
Raw materials
$588 $771
Work in
p
rocess
371 520
Finished
g
oods
78 167
Provision for excess and obsolete inventories (434) (431)
$603 $1,027