Blackberry 2013 Annual Report Download - page 149
Download and view the complete annual report
Please find page 149 of the 2013 Blackberry annual report below. You can navigate through the pages in the report by either clicking on the pages listed below, or by using the keyword search tool below to find specific information within the annual report.-
 1
1 -
2
-
3
-
4
-
5
-
6
-
7
-
8
-
9
-
10
-
11
-
12
-
13
-
14
-
15
-
16
-
17
-
18
-
19
-
20
-
21
-
22
-
23
-
24
-
25
-
26
-
27
-
28
-
29
-
30
-
31
-
32
-
33
-
34
-
35
-
36
-
37
-
38
-
39
-
40
-
41
-
42
-
43
-
44
-
45
-
46
-
47
-
48
-
49
-
50
-
51
-
52
-
53
-
54
-
55
-
56
-
57
-
58
-
59
-
60
-
61
-
62
-
63
-
64
-
65
-
66
-
67
-
68
-
69
-
70
-
71
-
72
-
73
-
74
-
75
-
76
-
77
-
78
-
79
-
80
-
81
-
82
-
83
-
84
-
85
-
86
-
87
-
88
-
89
-
90
-
91
-
92
-
93
-
94
-
95
-
96
-
97
-
98
-
99
-
100
-
101
-
102
-
103
-
104
-
105
-
106
-
107
-
108
-
109
-
110
-
111
-
112
-
113
-
114
-
115
-
116
-
117
-
118
-
119
-
120
-
121
-
122
-
123
-
124
-
125
-
126
-
127
-
128
-
129
-
130
-
131
-
132
-
133
-
134
-
135
-
136
-
137
-
138
-
 139
139 -
 140
140 -
 141
141 -
 142
142 -
 143
143 -
 144
144 -
 145
145 -
 146
146 -
 147
147 -
 148
148 -
 149
149 -
 150
150 -
 151
151 -
 152
152 -
 153
153 -
 154
154 -
 155
155 -
 156
156 -
 157
157 -
 158
158 -
 159
159 -
160
-
161
-
162
-
163
-
164
-
165
-
166
-
167
-
168
-
169
-
170
-
171
-
172
-
173
-
174
-
175
-
176
-
177
-
178
-
179
-
180
-
181
-
182
-
183
-
184
-
185
-
186
-
187
-
188
-
189
-
190
-
191
-
192
-
193
-
194
-
195
-
196
-
197
-
198
-
199
-
200
-
201
-
202
-
203
-
204
-
205
-
206
-
207
-
208
-
209
-
210
-
211
-
212
-
213
-
214
-
215
-
216
-
217
-
218
-
219
-
220
-
221
-
222
-
223
-
224
-
225
-
226
-
227
-
228
-
229
-
230
-
231
-
232
-
233
-
234
-
235
 |
 |

Research In Motion Limited
Notes to the Consolidated Financial Statements
In millions of United States dollars, except share and per share data, and except as otherwise indicated
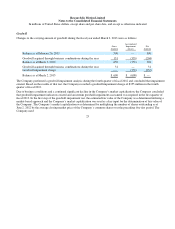
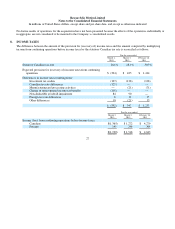
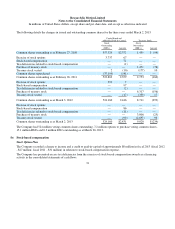
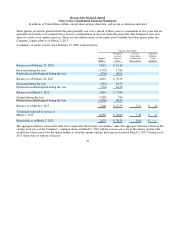
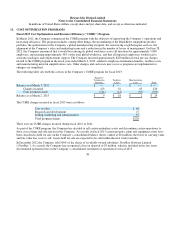
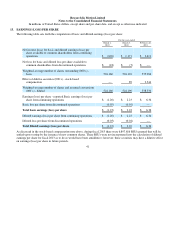
A summary of unvested stock options since March 3, 2012 is shown below:
As at March 2, 2013, there was $20 million of unrecognized stock-based compensation expense related to unvested stock
options which will be expensed over the vesting period, which, on a weighted-average basis, results in a period of approximately
1.7 years. The total fair value of stock options vested during the year ended March 2, 2013 was $14 million.
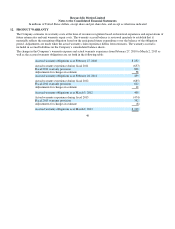
Cash received from the stock options exercised for the year ended March 2, 2013 was nil (March 2, 2013 - $9 million;
February 26, 2011 - $67 million). Tax deficiencies incurred by the Company related to the stock options exercised was $1
million at March 2, 2013 (March 3, 2012 – tax deficiency of $2 million; February 26, 2011 – tax deficiency of $1 million).
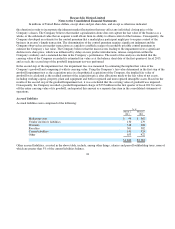
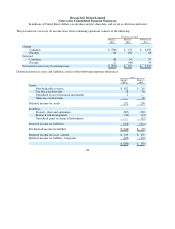
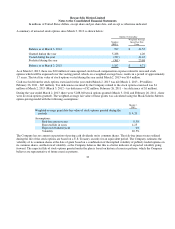
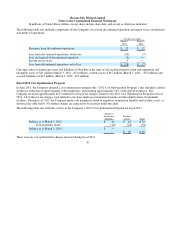
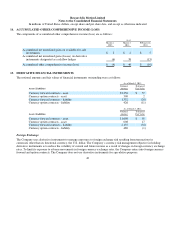
During the year ended March 2, 2013, there were 5,288,040 stock options granted (March 3, 2012 and February 26, 2011 - there
were no stock options granted). The weighted-average fair value of these grants was calculated using the Black-Scholes Merton
option-pricing model with the following assumptions:
The Company has no current expectation of paying cash dividends on its common shares. The risk-free interest rates utilized
during the life of the stock options are based on a U.S. Treasury security for an equivalent period. The Company estimates the
volatility of its common shares at the date of grant based on a combination of the implied volatility of publicly traded options on
its common shares, and historical volatility, as the Company believes that this is a better indicator of expected volatility going
forward. The expected life of stock options granted under the plan is based on historical exercise patterns, which the Company
believes are representative of future exercise patterns.
33
Options Outstanding
Number
(000’s)
Weighted-Average
Grant Date Fair
Value
Balance as at March 3, 2012 599 $41.53
Granted durin
g
the
y
ear 5,288 4.20
Vested durin
g
the
y
ear (339) 41.43
Forfeited durin
g
the
y
ear (361) 23.68
Balance as at March 2, 2013 5,187 $4.71
March 2,
2013
Weighted-average grant date fair value of stock options granted during the
p
eriods
$4.2
0
Assum
p
tions:
Ris
k
-free interest rates
0.5%
Ex
p
ected life in
y
ears
4.25
Ex
p
ected dividend
y
ield
0
%
Volatilit
y
69.5%