Blackberry 2013 Annual Report Download - page 200
Download and view the complete annual report
Please find page 200 of the 2013 Blackberry annual report below. You can navigate through the pages in the report by either clicking on the pages listed below, or by using the keyword search tool below to find specific information within the annual report.-
 1
1 -
2
-
3
-
4
-
5
-
6
-
7
-
8
-
9
-
10
-
11
-
12
-
13
-
14
-
15
-
16
-
17
-
18
-
19
-
20
-
21
-
22
-
23
-
24
-
25
-
26
-
27
-
28
-
29
-
30
-
31
-
32
-
33
-
34
-
35
-
36
-
37
-
38
-
39
-
40
-
41
-
42
-
43
-
44
-
45
-
46
-
47
-
48
-
49
-
50
-
51
-
52
-
53
-
54
-
55
-
56
-
57
-
58
-
59
-
60
-
61
-
62
-
63
-
64
-
65
-
66
-
67
-
68
-
69
-
70
-
71
-
72
-
73
-
74
-
75
-
76
-
77
-
78
-
79
-
80
-
81
-
82
-
83
-
84
-
85
-
86
-
87
-
88
-
89
-
90
-
91
-
92
-
93
-
94
-
95
-
96
-
97
-
98
-
99
-
100
-
101
-
102
-
103
-
104
-
105
-
106
-
107
-
108
-
109
-
110
-
111
-
112
-
113
-
114
-
115
-
116
-
117
-
118
-
119
-
120
-
121
-
122
-
123
-
124
-
125
-
126
-
127
-
128
-
129
-
130
-
131
-
132
-
133
-
134
-
135
-
136
-
137
-
138
-
139
-
140
-
141
-
142
-
143
-
144
-
145
-
146
-
147
-
148
-
149
-
150
-
151
-
152
-
153
-
154
-
155
-
156
-
157
-
158
-
159
-
160
-
161
-
162
-
163
-
164
-
165
-
166
-
167
-
168
-
169
-
170
-
171
-
172
-
173
-
174
-
175
-
176
-
177
-
178
-
179
-
180
-
181
-
182
-
183
-
184
-
185
-
186
-
187
-
188
-
189
-
 190
190 -
 191
191 -
 192
192 -
 193
193 -
 194
194 -
 195
195 -
 196
196 -
 197
197 -
 198
198 -
 199
199 -
 200
200 -
 201
201 -
 202
202 -
 203
203 -
 204
204 -
 205
205 -
 206
206 -
 207
207 -
 208
208 -
 209
209 -
 210
210 -
211
-
212
-
213
-
214
-
215
-
216
-
217
-
218
-
219
-
220
-
221
-
222
-
223
-
224
-
225
-
226
-
227
-
228
-
229
-
230
-
231
-
232
-
233
-
234
-
235
 |
 |

Research In Motion Limited
Management’s Discussion and Analysis of Financial Condition and Results of Operations
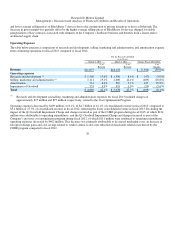
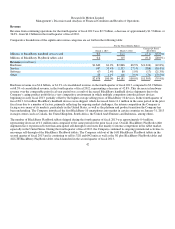
decision to develop a new single hardware platform and the BlackBerry 7 operating system for its high-end BlackBerry lineup. These
changes, among other things, affected both the hardware and software timelines and pushed out entry into carrier certification labs. As
noted in the “Risk Factors” section of The Company’s Annual Information Form, there are always risks and uncertainties in new
product development and these changes presented extra challenges to carrier lab entry and the certification process. The mix of
BlackBerry handheld devices in the first and second quarters of fiscal 2012 were heavily weighted towards its BlackBerry 6 handheld
devices, particularly at the low end of the range, which had lower average selling prices and contribution margin than its BlackBerry
7 products. The Company also observed lower than expected shipments of its BlackBerry 6 handheld devices as customers worked
through inventory and awaited the launch of the BlackBerry 7 handheld devices. However, delays in the product introduction
timelines for its BlackBerry 7 handhelds devices also excluded the Company from some of the back-to-school programs it had
expected to be a part of, which resulted in lower than anticipated shipments, revenue and earnings in the second quarter of fiscal
2012. While the BlackBerry Bold 9900 was well received by customers, certain other BlackBerry 7 product sales in fiscal 2012 were
lower than expected due to competitive launches, the Q3 Service Interruption and BlackBerry 7 product launch delays.
Outside of North America, overall performance was strong although competitive shifts are making growth in international markets
increasingly more challenging, and the Company was not satisfied with the performance of the business in the United States, as
described in further detail below.
Contributing to hardware revenue in fiscal 2012 was the launch of the BlackBerry PlayBook tablet in the first quarter of the fiscal
year. The number of BlackBerry PlayBook tablets shipped during fiscal 2012 was 1.0 million units. BlackBerry PlayBook tablet
shipments were lower than anticipated during fiscal 2012 due to lower than anticipated sell-through to end users caused by several
factors, including intense competition in the tablet market, especially in the United States, and shifts in the competitive dynamics of
the market, as well as a delay in the release of BlackBerry PlayBook OS 2.0 software until February 2012. During the second half of
fiscal 2012, the Company increased its promotional activity to encourage sell-through of the BlackBerry PlayBook tablets.
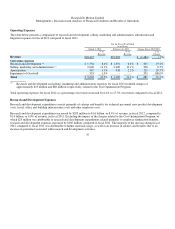
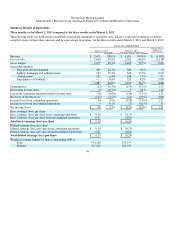
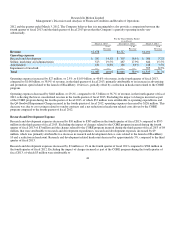
Service revenue increased by $877 million, or 27.4%, to $4.1 billion or 22.1% of consolidated revenue in fiscal 2012, compared to
$3.2 billion, or 16.1% of consolidated revenue in fiscal 2011, reflecting the Company’s increase in net new BlackBerry subscriber
accounts since the end of fiscal 2011. Partially offsetting this increase was the loss of revenue and penalty charges associated with the
Q3 Service Interruption totaling approximately $54 million. BlackBerry tiered service plans continued to drive growth in the
Company’s subscriber base, specifically in the Company’s international markets, including Indonesia, South Africa and Venezuela.
The international growth was offset by particularly weak results in fiscal 2012 in the United States where the Company experienced a
net decrease in its subscriber base.
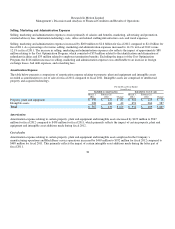
Software revenue includes fees from licensed BES software, CALs, technical support, maintenance and upgrades. Software revenue
increased by $24 million, or 8.2%, to $318 million in fiscal 2012 from $294 million in fiscal 2011. The increase was primarily
attributable to an increase in software upgrades and revenue from acquisitions, and this was partially offset by a decrease in BES,
CALs and software licensing revenue.
Other revenue, which includes non-warranty repairs, accessories and gains and losses on revenue hedging instruments, decreased by
$223 million to $237 million in fiscal 2012 compared to $460 million in fiscal 2011. The majority of the decrease was attributable to
decreases in non-warranty repairs and losses realized from revenue hedging. See “Market Risk of Financial Instruments – Foreign
Exchange” for additional information on the Company’s hedging instruments.
35