Blackberry 2013 Annual Report Download - page 121
Download and view the complete annual report
Please find page 121 of the 2013 Blackberry annual report below. You can navigate through the pages in the report by either clicking on the pages listed below, or by using the keyword search tool below to find specific information within the annual report.-
 1
1 -
2
-
3
-
4
-
5
-
6
-
7
-
8
-
9
-
10
-
11
-
12
-
13
-
14
-
15
-
16
-
17
-
18
-
19
-
20
-
21
-
22
-
23
-
24
-
25
-
26
-
27
-
28
-
29
-
30
-
31
-
32
-
33
-
34
-
35
-
36
-
37
-
38
-
39
-
40
-
41
-
42
-
43
-
44
-
45
-
46
-
47
-
48
-
49
-
50
-
51
-
52
-
53
-
54
-
55
-
56
-
57
-
58
-
59
-
60
-
61
-
62
-
63
-
64
-
65
-
66
-
67
-
68
-
69
-
70
-
71
-
72
-
73
-
74
-
75
-
76
-
77
-
78
-
79
-
80
-
81
-
82
-
83
-
84
-
85
-
86
-
87
-
88
-
89
-
90
-
91
-
92
-
93
-
94
-
95
-
96
-
97
-
98
-
99
-
100
-
101
-
102
-
103
-
104
-
105
-
106
-
107
-
108
-
109
-
110
-
 111
111 -
 112
112 -
 113
113 -
 114
114 -
 115
115 -
 116
116 -
 117
117 -
 118
118 -
 119
119 -
 120
120 -
 121
121 -
 122
122 -
 123
123 -
 124
124 -
 125
125 -
 126
126 -
 127
127 -
 128
128 -
 129
129 -
 130
130 -
 131
131 -
132
-
133
-
134
-
135
-
136
-
137
-
138
-
139
-
140
-
141
-
142
-
143
-
144
-
145
-
146
-
147
-
148
-
149
-
150
-
151
-
152
-
153
-
154
-
155
-
156
-
157
-
158
-
159
-
160
-
161
-
162
-
163
-
164
-
165
-
166
-
167
-
168
-
169
-
170
-
171
-
172
-
173
-
174
-
175
-
176
-
177
-
178
-
179
-
180
-
181
-
182
-
183
-
184
-
185
-
186
-
187
-
188
-
189
-
190
-
191
-
192
-
193
-
194
-
195
-
196
-
197
-
198
-
199
-
200
-
201
-
202
-
203
-
204
-
205
-
206
-
207
-
208
-
209
-
210
-
211
-
212
-
213
-
214
-
215
-
216
-
217
-
218
-
219
-
220
-
221
-
222
-
223
-
224
-
225
-
226
-
227
-
228
-
229
-
230
-
231
-
232
-
233
-
234
-
235
 |
 |

Research In Motion Limited
Notes to the Consolidated Financial Statements
In millions of United States dollars, except share and per share data, and except as otherwise indicated
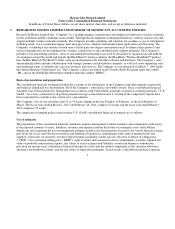
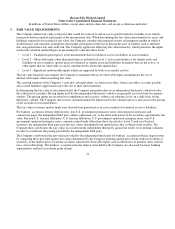
In the second step of the goodwill impairment test, the implied fair value of the reporting unit’s goodwill is compared with its
carrying amount to measure the amount of the impairment loss, if any. The implied fair value of goodwill is determined in the
same manner as the value of goodwill is determined in a business combination using the fair value of the reporting unit as if it
were the acquisition price. When the carrying amount of the reporting unit’s goodwill exceeds the implied fair value of the
goodwill, an impairment loss is recognized in an amount equal to the excess and is presented as a separate line item in the
consolidated statements of operations. Establishing an implied fair value of goodwill requires the Company to make estimates
for key inputs into complex valuation models and to apply significant judgment in the selection of estimates, assumptions and
methodologies required to complete the analysis. Areas of judgment include, but are not limited to, development of multi-year
business cash flow forecasts, the selection of discount rates and the identification and valuation of unrecorded assets.
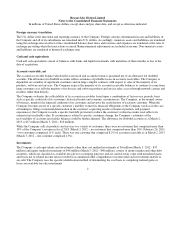
Intangible assets
Intangible assets with definite lives are stated at cost less accumulated amortization. The Company is currently amortizing its
intangible assets with finite lives over periods generally ranging between two to ten years.
Impairment of long-lived assets
The Company reviews long-lived assets such as property, plant and equipment and intangible assets with finite useful lives for
impairment whenever events or changes in circumstances indicate that the carrying amount may not be recoverable. If the total
of the expected undiscounted future cash flows is less than the carrying amount of the asset, a loss is recognized for the excess
of the carrying amount over the fair value of the asset.
Assets held for sale and discontinued operations
Assets held for sale and related liabilities are reported separately on the Company’s consolidated balance sheets at the lower of
their carrying value and fair value less costs to sell, if material. If the carrying value exceeds the fair value less costs to sell, a
loss is recognized. Assets classified as held for sale are no longer amortized. Comparative figures are reclassified to conform to
the current year’s presentation.
When the Company has disposed of or classified as held for sale a component of the entity, and certain criteria are met, the
results of operations of the component, including any loss recognized, are reported separately on the consolidated statements of
operations as discontinued operations. Discontinued operations are presented if the component’s operations and cash flows have
been, or will be, eliminated from the Company and the Company will not have significant continuing involvement in the
operations of the component after the disposal. Earnings (loss) per share amounts for both continuing operations and
discontinued operations are presented separately on the consolidated statements of operations and income (loss) from continuing
operations and loss from discontinued operations are reported separately on the consolidated statements of cash flows.
Comparative figures are reclassified to conform to the current year’s presentation.
Income taxes
The Company uses the liability method of income tax allocation to account for income taxes. Deferred income tax assets and
liabilities are recognized based upon temporary differences between the financial reporting and income tax bases of assets and
liabilities, and measured using enacted income tax rates and laws that will be in
5