Blackberry 2013 Annual Report Download - page 162
Download and view the complete annual report
Please find page 162 of the 2013 Blackberry annual report below. You can navigate through the pages in the report by either clicking on the pages listed below, or by using the keyword search tool below to find specific information within the annual report.-
 1
1 -
2
-
3
-
4
-
5
-
6
-
7
-
8
-
9
-
10
-
11
-
12
-
13
-
14
-
15
-
16
-
17
-
18
-
19
-
20
-
21
-
22
-
23
-
24
-
25
-
26
-
27
-
28
-
29
-
30
-
31
-
32
-
33
-
34
-
35
-
36
-
37
-
38
-
39
-
40
-
41
-
42
-
43
-
44
-
45
-
46
-
47
-
48
-
49
-
50
-
51
-
52
-
53
-
54
-
55
-
56
-
57
-
58
-
59
-
60
-
61
-
62
-
63
-
64
-
65
-
66
-
67
-
68
-
69
-
70
-
71
-
72
-
73
-
74
-
75
-
76
-
77
-
78
-
79
-
80
-
81
-
82
-
83
-
84
-
85
-
86
-
87
-
88
-
89
-
90
-
91
-
92
-
93
-
94
-
95
-
96
-
97
-
98
-
99
-
100
-
101
-
102
-
103
-
104
-
105
-
106
-
107
-
108
-
109
-
110
-
111
-
112
-
113
-
114
-
115
-
116
-
117
-
118
-
119
-
120
-
121
-
122
-
123
-
124
-
125
-
126
-
127
-
128
-
129
-
130
-
131
-
132
-
133
-
134
-
135
-
136
-
137
-
138
-
139
-
140
-
141
-
142
-
143
-
144
-
145
-
146
-
147
-
148
-
149
-
150
-
151
-
 152
152 -
 153
153 -
 154
154 -
 155
155 -
 156
156 -
 157
157 -
 158
158 -
 159
159 -
 160
160 -
 161
161 -
 162
162 -
 163
163 -
 164
164 -
 165
165 -
 166
166 -
 167
167 -
 168
168 -
 169
169 -
 170
170 -
 171
171 -
 172
172 -
173
-
174
-
175
-
176
-
177
-
178
-
179
-
180
-
181
-
182
-
183
-
184
-
185
-
186
-
187
-
188
-
189
-
190
-
191
-
192
-
193
-
194
-
195
-
196
-
197
-
198
-
199
-
200
-
201
-
202
-
203
-
204
-
205
-
206
-
207
-
208
-
209
-
210
-
211
-
212
-
213
-
214
-
215
-
216
-
217
-
218
-
219
-
220
-
221
-
222
-
223
-
224
-
225
-
226
-
227
-
228
-
229
-
230
-
231
-
232
-
233
-
234
-
235
 |
 |

Research In Motion Limited
Notes to the Consolidated Financial Statements
In millions of United States dollars, except share and per share data, and except as otherwise indicated
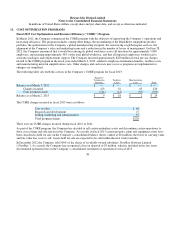
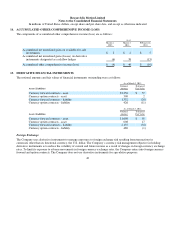
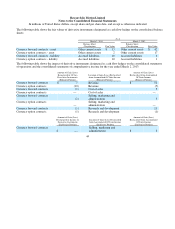
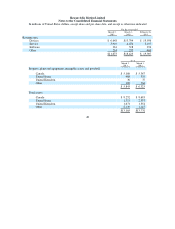
The following table shows the fair values of derivative instruments that are not subject to hedge accounting on the consolidated
balance sheets:
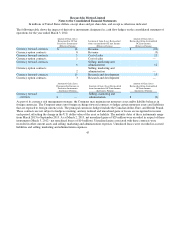
The following table shows the impact of derivative instruments that are not subject to hedge accounting on the consolidated
statement of operations for the year ended March 2, 2013:
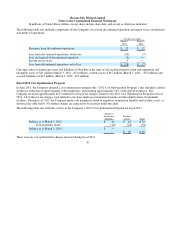
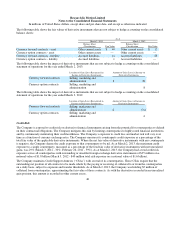
The following table shows the impact of derivative instruments that are not subject to hedge accounting on the consolidated
statement of operations for the year ended March 3, 2012:
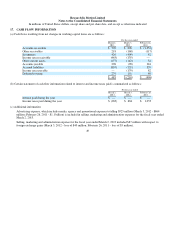
Credit Risk
The Company is exposed to credit risk on derivative financial instruments arising from the potential for counterparties to default
on their contractual obligations. The Company mitigates this risk by limiting counterparties to highly rated financial institutions
and by continuously monitoring their creditworthiness. The Company’s exposure to credit loss and market risk will vary over
time as a function of currency exchange rates. The Company measures its counterparty credit exposure as a percentage of the
total fair value of the applicable derivative instruments. Where the net fair value of derivative instruments with any counterparty
is negative, the Company deems the credit exposure to that counterparty to be nil. As at March 2, 2013, the maximum credit
exposure to a single counterparty, measured as a percentage of the total fair value of derivative instruments with net unrealized
gains, was 29% (March 3, 2012 - 30%; February 26, 2011 - 59%). As at March 2, 2013, the Company had a total credit risk
exposure across all counterparties with outstanding or unsettled foreign exchange derivative instruments of $35 million on a
notional value of $1.8 billion (March 3, 2012 - $40 million total risk exposure on a notional value of $1.6 billion).
The Company maintains Credit Support Annexes (“CSAs”) with several of its counterparties. These CSAs require that the
outstanding net position of all contracts to be made whole by the paying or receiving of collateral to or from the counterparties
on a daily basis, subject to exposure and transfer thresholds. As at March 2, 2013, the Company was holding $5 million of
collateral from counterparties, approximating the fair value of those contracts. As with the derivatives recorded in an unrealized
gain position, this amount is recorded in other current assets.
46
As at
March 2, 2013 March 3, 2012
Balance Sheet Balance Sheet
Classification Fair Value Classification
Fair Valu
e
Currency forward contracts - asset Other current assets $44 Other current assets $13
Currenc
y
o
p
tion contracts - asset
Other current assets
—
Other current assets
—
Currenc
y
forward contracts - liabilit
y
Accrued liabilities 14 Accrued liabilities 28
Currenc
y
o
p
tion contracts - liabilit
y
Accrued liabilities 1 Accrued liabilities
—
Location of Gain (Loss) Recognized in Amount of Gain (Loss) in Income on
Income on Derivative Instruments Derivative Instruments
Currency forward contracts
Selling, marketing and
administration $38
Currency option contracts
Selling, marketing and
administration 8
Location of Gain (Loss) Recognized in Amount of Gain (Loss) in Income on
Income on Derivative Instruments Derivative Instruments
Currency forward contracts
Selling, marketing and
administration $(74)
Currency option contracts
Selling, marketing and
administration 4