Blackberry 2013 Annual Report Download - page 211
Download and view the complete annual report
Please find page 211 of the 2013 Blackberry annual report below. You can navigate through the pages in the report by either clicking on the pages listed below, or by using the keyword search tool below to find specific information within the annual report.-
 1
1 -
2
-
3
-
4
-
5
-
6
-
7
-
8
-
9
-
10
-
11
-
12
-
13
-
14
-
15
-
16
-
17
-
18
-
19
-
20
-
21
-
22
-
23
-
24
-
25
-
26
-
27
-
28
-
29
-
30
-
31
-
32
-
33
-
34
-
35
-
36
-
37
-
38
-
39
-
40
-
41
-
42
-
43
-
44
-
45
-
46
-
47
-
48
-
49
-
50
-
51
-
52
-
53
-
54
-
55
-
56
-
57
-
58
-
59
-
60
-
61
-
62
-
63
-
64
-
65
-
66
-
67
-
68
-
69
-
70
-
71
-
72
-
73
-
74
-
75
-
76
-
77
-
78
-
79
-
80
-
81
-
82
-
83
-
84
-
85
-
86
-
87
-
88
-
89
-
90
-
91
-
92
-
93
-
94
-
95
-
96
-
97
-
98
-
99
-
100
-
101
-
102
-
103
-
104
-
105
-
106
-
107
-
108
-
109
-
110
-
111
-
112
-
113
-
114
-
115
-
116
-
117
-
118
-
119
-
120
-
121
-
122
-
123
-
124
-
125
-
126
-
127
-
128
-
129
-
130
-
131
-
132
-
133
-
134
-
135
-
136
-
137
-
138
-
139
-
140
-
141
-
142
-
143
-
144
-
145
-
146
-
147
-
148
-
149
-
150
-
151
-
152
-
153
-
154
-
155
-
156
-
157
-
158
-
159
-
160
-
161
-
162
-
163
-
164
-
165
-
166
-
167
-
168
-
169
-
170
-
171
-
172
-
173
-
174
-
175
-
176
-
177
-
178
-
179
-
180
-
181
-
182
-
183
-
184
-
185
-
186
-
187
-
188
-
189
-
190
-
191
-
192
-
193
-
194
-
195
-
196
-
197
-
198
-
199
-
200
-
 201
201 -
 202
202 -
 203
203 -
 204
204 -
 205
205 -
 206
206 -
 207
207 -
 208
208 -
 209
209 -
 210
210 -
 211
211 -
 212
212 -
 213
213 -
 214
214 -
 215
215 -
 216
216 -
 217
217 -
 218
218 -
 219
219 -
 220
220 -
 221
221 -
222
-
223
-
224
-
225
-
226
-
227
-
228
-
229
-
230
-
231
-
232
-
233
-
234
-
235
 |
 |

Research In Motion Limited
Management’s Discussion and Analysis of Financial Condition and Results of Operations
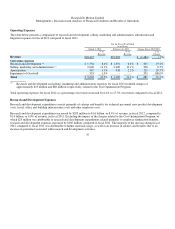
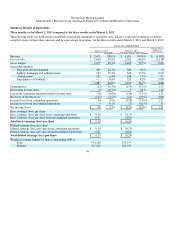
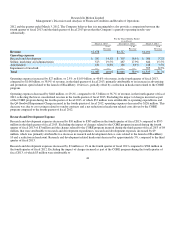
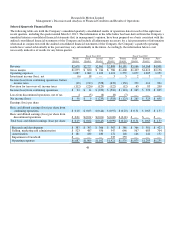
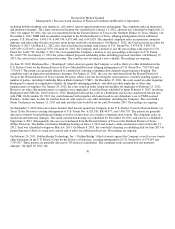
Amortization Expense
The table below presents a comparison of amortization expense relating to property, plant and equipment and intangible assets
recorded as amortization or cost of sales for the quarter ended March 2, 2013 compared to the quarter ended March 3, 2012.
Intangible assets are comprised of intellectual property and acquired technology.
A
mortization
Amortization expense relating to certain property, plant and equipment and certain intangible assets increased by $33 million to $181
million for the fourth quarter of fiscal 2013 compared to $148 million for the comparable period in fiscal 2012, which primarily
reflects the impact of certain property, plant and equipment and intangible asset additions made during fiscal 2013.
Cost of sales
Amortization expense relating to certain property, plant and equipment and certain intangible assets employed in the Company’s
manufacturing operations and BlackBerry service operations decreased by $24 million to $213 million for the fourth quarter of fiscal
2013 compared to $237 million for the comparable period in fiscal 2012. The increase primarily reflects the impact of certain
property, plant and equipment and intangible asset additions made during fiscal 2013.
Investment Income
Investment income decreased by $11 million to a loss of $6 million in the fourth quarter of fiscal 2013 from a gain of $5 million in
the fourth quarter of fiscal 2012. The decrease in investment income is a result of decreases in the Company’s average yield on its
investments, the recording of the Company’s portion of investment losses in its equity-based investments, and the accrual of interest
expenses for other tax matters. See “Financial Condition - Liquidity and Capital Resources”.
Income Taxes
For the fourth quarter of fiscal 2013, the Company’s income tax recovery from continuing operations was $112 million, resulting in
an effective income tax recovery rate of 638.9% compared to income tax recovery of $12 million and an effective income tax
recovery rate of 9.2% for the same period last year. The
46
For the Three Months Ended
(in millions)
Included in Amortization Included in Cost of sales
March 2,
2013
March 3,
2012 Change
March 2,
2013
March 3,
2012 Change
Property, plant and equipment
$103 $94 $ 9 $77 $77 $
—
Intan
g
ible assets
78 54 24 136
160
(24)
Total
$181 $148 $33 $213 $237 $(24)