Blackberry 2013 Annual Report Download - page 213
Download and view the complete annual report
Please find page 213 of the 2013 Blackberry annual report below. You can navigate through the pages in the report by either clicking on the pages listed below, or by using the keyword search tool below to find specific information within the annual report.-
 1
1 -
2
-
3
-
4
-
5
-
6
-
7
-
8
-
9
-
10
-
11
-
12
-
13
-
14
-
15
-
16
-
17
-
18
-
19
-
20
-
21
-
22
-
23
-
24
-
25
-
26
-
27
-
28
-
29
-
30
-
31
-
32
-
33
-
34
-
35
-
36
-
37
-
38
-
39
-
40
-
41
-
42
-
43
-
44
-
45
-
46
-
47
-
48
-
49
-
50
-
51
-
52
-
53
-
54
-
55
-
56
-
57
-
58
-
59
-
60
-
61
-
62
-
63
-
64
-
65
-
66
-
67
-
68
-
69
-
70
-
71
-
72
-
73
-
74
-
75
-
76
-
77
-
78
-
79
-
80
-
81
-
82
-
83
-
84
-
85
-
86
-
87
-
88
-
89
-
90
-
91
-
92
-
93
-
94
-
95
-
96
-
97
-
98
-
99
-
100
-
101
-
102
-
103
-
104
-
105
-
106
-
107
-
108
-
109
-
110
-
111
-
112
-
113
-
114
-
115
-
116
-
117
-
118
-
119
-
120
-
121
-
122
-
123
-
124
-
125
-
126
-
127
-
128
-
129
-
130
-
131
-
132
-
133
-
134
-
135
-
136
-
137
-
138
-
139
-
140
-
141
-
142
-
143
-
144
-
145
-
146
-
147
-
148
-
149
-
150
-
151
-
152
-
153
-
154
-
155
-
156
-
157
-
158
-
159
-
160
-
161
-
162
-
163
-
164
-
165
-
166
-
167
-
168
-
169
-
170
-
171
-
172
-
173
-
174
-
175
-
176
-
177
-
178
-
179
-
180
-
181
-
182
-
183
-
184
-
185
-
186
-
187
-
188
-
189
-
190
-
191
-
192
-
193
-
194
-
195
-
196
-
197
-
198
-
199
-
200
-
201
-
202
-
 203
203 -
 204
204 -
 205
205 -
 206
206 -
 207
207 -
 208
208 -
 209
209 -
 210
210 -
 211
211 -
 212
212 -
 213
213 -
 214
214 -
 215
215 -
 216
216 -
 217
217 -
 218
218 -
 219
219 -
 220
220 -
 221
221 -
 222
222 -
 223
223 -
224
-
225
-
226
-
227
-
228
-
229
-
230
-
231
-
232
-
233
-
234
-
235
 |
 |

Research In Motion Limited
Management’s Discussion and Analysis of Financial Condition and Results of Operations
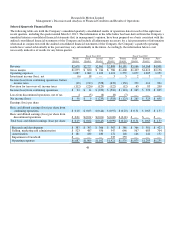
Selected Quarterly Financial Data
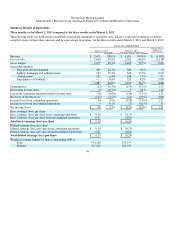
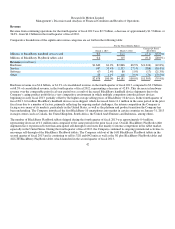
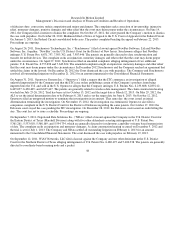
The following table sets forth the Company’s unaudited quarterly consolidated results of operations data for each of the eight most
recent quarters, including the quarter ended March 2, 2013. The information in the table below has been derived from the Company’s
unaudited interim consolidated financial statements that, in management’s opinion, have been prepared on a basis consistent with the
audited consolidated financial statements of the Company and include all adjustments necessary for a fair presentation of information
when read in conjunction with the audited consolidated financial statements of the Company. the Company’s quarterly operating
results have varied substantially in the past and may vary substantially in the future. Accordingly, the information below is not
necessarily indicative of results for any future quarter.
48
Fiscal Year 2013 Fiscal Year 2012
Fourth
Quarter
Third
Quarter
Second
Quarter
First
Quarter
Fourth
Quarter
Third
Quarter
Second
Quarter
First
Quarter
(in millions, except per share data)
Revenue
$2,678 $2,727 $2,861 $2,808 $4,181 $5,166 $4,168 $4,908
Gross mar
g
in
$1,075 $ 830 $ 744 $ 786 $1,400
$1,407 $1,612 $2,156
Operating expenses
1,087 1,060 1,102 1,421 1,535 1,079 1,205 1,259
Investment income (loss), net
(6)
18
—
3
5 2
7
7
Income (loss) from continuing operations, before
income taxes
(18) (212) (358) (632) (13
0
) 33
0
414 904
Provision for (recover
y
of) income taxes (112)
(226) (129) (122) (12) 65
85
209
Income (loss) from continuin
g
o
p
erations $94 $14 $ (229) $(510) $(118) $265 $329 $695
Loss from discontinued o
p
erations, net of tax 4 (5) (6) (8) (7)
—
—
—
Net income (loss)
$98 $ 9 $(235) $(518) $(125) $265 $329 $695
Earnin
g
s (loss)
p
er share
Basic and diluted earnings (loss) per share from
continuin
g
o
p
erations
$0.18 $0.03 $ (0.44) $(0.97) $(0.23) $0.51 $0.63 $1.33
Basic and diluted earnings (loss) per share from
discontinued o
p
erations
$ 0.01 $ (0.01) $ (0.01) $ (0.02) $ (0.01) $
—
$
—
$
—
Total basic and diluted earnin
g
s (loss)
p
er share
$0.19 $0.02 $ (0.45) $(0.99) $(0.24) $0.51 $0.63 $1.33
Research and develo
p
ment
$383 $393 $ 366 $ 367 $ 386 $366 $381 $423
Selling, marketing and administration $ 523 487 556 547 646 567
683
704
Amortization
$181 180 18
0
172 148 146 141 132
Im
p
airment of Goodwill
$
—
—
—
335 355
—
—
—
O
p
eratin
g
ex
p
enses
$1,087 $1,060 $1,102 $1,421 $1,535 $1,079 $1,205 $1,259