Blackberry 2013 Annual Report Download - page 116
Download and view the complete annual report
Please find page 116 of the 2013 Blackberry annual report below. You can navigate through the pages in the report by either clicking on the pages listed below, or by using the keyword search tool below to find specific information within the annual report.-
 1
1 -
2
-
3
-
4
-
5
-
6
-
7
-
8
-
9
-
10
-
11
-
12
-
13
-
14
-
15
-
16
-
17
-
18
-
19
-
20
-
21
-
22
-
23
-
24
-
25
-
26
-
27
-
28
-
29
-
30
-
31
-
32
-
33
-
34
-
35
-
36
-
37
-
38
-
39
-
40
-
41
-
42
-
43
-
44
-
45
-
46
-
47
-
48
-
49
-
50
-
51
-
52
-
53
-
54
-
55
-
56
-
57
-
58
-
59
-
60
-
61
-
62
-
63
-
64
-
65
-
66
-
67
-
68
-
69
-
70
-
71
-
72
-
73
-
74
-
75
-
76
-
77
-
78
-
79
-
80
-
81
-
82
-
83
-
84
-
85
-
86
-
87
-
88
-
89
-
90
-
91
-
92
-
93
-
94
-
95
-
96
-
97
-
98
-
99
-
100
-
101
-
102
-
103
-
104
-
105
-
 106
106 -
 107
107 -
 108
108 -
 109
109 -
 110
110 -
 111
111 -
 112
112 -
 113
113 -
 114
114 -
 115
115 -
 116
116 -
 117
117 -
 118
118 -
 119
119 -
 120
120 -
 121
121 -
 122
122 -
 123
123 -
 124
124 -
 125
125 -
 126
126 -
127
-
128
-
129
-
130
-
131
-
132
-
133
-
134
-
135
-
136
-
137
-
138
-
139
-
140
-
141
-
142
-
143
-
144
-
145
-
146
-
147
-
148
-
149
-
150
-
151
-
152
-
153
-
154
-
155
-
156
-
157
-
158
-
159
-
160
-
161
-
162
-
163
-
164
-
165
-
166
-
167
-
168
-
169
-
170
-
171
-
172
-
173
-
174
-
175
-
176
-
177
-
178
-
179
-
180
-
181
-
182
-
183
-
184
-
185
-
186
-
187
-
188
-
189
-
190
-
191
-
192
-
193
-
194
-
195
-
196
-
197
-
198
-
199
-
200
-
201
-
202
-
203
-
204
-
205
-
206
-
207
-
208
-
209
-
210
-
211
-
212
-
213
-
214
-
215
-
216
-
217
-
218
-
219
-
220
-
221
-
222
-
223
-
224
-
225
-
226
-
227
-
228
-
229
-
230
-
231
-
232
-
233
-
234
-
235
 |
 |

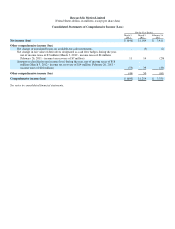
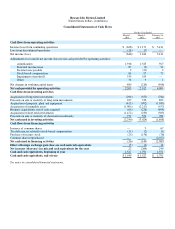
Research In Motion Limited
(United States dollars, in millions)
Consolidated Statements of Cash Flows
See notes to consolidated financial statements.
For the Year Ended
March 2,
2013
March 3,
2012
February 26,
2011
Cash flows from operating activities
Income (loss) from continuin
g
o
p
erations $ (628) $ 1,171 $ 3,411
Loss from discontinued o
p
erations
(18) (7)
—
Net income (loss)
(646) 1,164
3,411
Ad
j
ustments to reconcile net income (loss) to net cash
p
rovided b
y
o
p
eratin
g
activities:
Amortization
1,918 1,523
927
Deferred income taxes
87 (5) 92
Income taxes
p
a
y
able
2 (21)
2
Stoc
k
-based com
p
ensation
86 97 72
Im
p
airment of
g
oodwill
335 355
—
Other
36 9 1
Net chan
g
es in workin
g
ca
p
ital items
485 (21
0
) (496)
Net cash provided by operating activities 2,303 2,912 4,009
Cash flows from investing activities
Ac
q
uisition of lon
g
-term investments
(296) (355) (784)
Proceeds on sale or maturit
y
of lon
g
-term investments
227 376
893
Ac
q
uisition of
p
ro
p
ert
y
,
p
lant and e
q
ui
p
ment (413) (902) (1,039)
Ac
q
uisition of intan
g
ible assets
(1,005) (2,217)
(557)
Business ac
q
uisitions, net of cash ac
q
uired (6
0
) (226) (494)
Ac
q
uisition of short-term investments
(1,472) (25
0
) (503)
Proceeds on sale or maturit
y
of short-term investments
779 55
0
786
Net cash used in investing activities
(2,24
0
) (3,024)
(1,698)
Cash flows from financing activities
Issuance of common shares
—
9
67
Tax deficiencies related to stoc
k
-based com
p
ensation
(11) (2) (1)
Purchase of treasur
y
stoc
k
(25) (156)
(76)
Common shares re
p
urchased
—
—
(2,077)
Net cash used in financing activities
(36) (149)
(2,087)
Effect of foreign exchange gain (loss) on cash and cash equivalents (5) (3) 16
Net increase (decrease) in cash and cash equivalents for the year 22 (264)
240
Cash and cash equivalents, beginning of year
1,527 1,791 1,551
Cash and cash equivalents, end of year $ 1,549 $ 1,527 $ 1,791