Blackberry 2013 Annual Report Download - page 197
Download and view the complete annual report
Please find page 197 of the 2013 Blackberry annual report below. You can navigate through the pages in the report by either clicking on the pages listed below, or by using the keyword search tool below to find specific information within the annual report.-
 1
1 -
2
-
3
-
4
-
5
-
6
-
7
-
8
-
9
-
10
-
11
-
12
-
13
-
14
-
15
-
16
-
17
-
18
-
19
-
20
-
21
-
22
-
23
-
24
-
25
-
26
-
27
-
28
-
29
-
30
-
31
-
32
-
33
-
34
-
35
-
36
-
37
-
38
-
39
-
40
-
41
-
42
-
43
-
44
-
45
-
46
-
47
-
48
-
49
-
50
-
51
-
52
-
53
-
54
-
55
-
56
-
57
-
58
-
59
-
60
-
61
-
62
-
63
-
64
-
65
-
66
-
67
-
68
-
69
-
70
-
71
-
72
-
73
-
74
-
75
-
76
-
77
-
78
-
79
-
80
-
81
-
82
-
83
-
84
-
85
-
86
-
87
-
88
-
89
-
90
-
91
-
92
-
93
-
94
-
95
-
96
-
97
-
98
-
99
-
100
-
101
-
102
-
103
-
104
-
105
-
106
-
107
-
108
-
109
-
110
-
111
-
112
-
113
-
114
-
115
-
116
-
117
-
118
-
119
-
120
-
121
-
122
-
123
-
124
-
125
-
126
-
127
-
128
-
129
-
130
-
131
-
132
-
133
-
134
-
135
-
136
-
137
-
138
-
139
-
140
-
141
-
142
-
143
-
144
-
145
-
146
-
147
-
148
-
149
-
150
-
151
-
152
-
153
-
154
-
155
-
156
-
157
-
158
-
159
-
160
-
161
-
162
-
163
-
164
-
165
-
166
-
167
-
168
-
169
-
170
-
171
-
172
-
173
-
174
-
175
-
176
-
177
-
178
-
179
-
180
-
181
-
182
-
183
-
184
-
185
-
186
-
 187
187 -
 188
188 -
 189
189 -
 190
190 -
 191
191 -
 192
192 -
 193
193 -
 194
194 -
 195
195 -
 196
196 -
 197
197 -
 198
198 -
 199
199 -
 200
200 -
 201
201 -
 202
202 -
 203
203 -
 204
204 -
 205
205 -
 206
206 -
 207
207 -
208
-
209
-
210
-
211
-
212
-
213
-
214
-
215
-
216
-
217
-
218
-
219
-
220
-
221
-
222
-
223
-
224
-
225
-
226
-
227
-
228
-
229
-
230
-
231
-
232
-
233
-
234
-
235
 |
 |

Research In Motion Limited
Management’s Discussion and Analysis of Financial Condition and Results of Operations
market capitalization for the preceding five days from the impairment test date, plus a reasonable control premium, which was
established based on recent market transactions. The results from the first step of the goodwill impairment test demonstrated that the
carrying value of the Company exceeded its estimated fair value as at the balance sheet date and therefore the second step of the
goodwill impairment test was performed.
In the second step of the impairment test, the Company calculated the impairment loss by estimating the implied fair value of
goodwill and comparing it with its carrying value. Using the fair value determined in the first step as the acquisition price, the implied
fair value of goodwill was calculated as the residual amount of the acquisition price after allocations made to the fair value of net
assets, including recognized and unrecognized intangible assets. Based on the results of the second step of the goodwill impairment
test, it was concluded that the carrying value of goodwill was impaired. Consequently, the Company recorded the Q1 Goodwill
Impairment Charge of $335 million, which eliminated the remaining carrying value of its goodwill, and reported this amount as a
separate line item in the Consolidated Statements of Operations.
The Company’s share price and control premium are significant factors in assessing the Company’s fair value for purposes of the
goodwill impairment assessment. The Company’s share price can be affected by, among other things, changes in industry or market
conditions, including the effect of competition, changes in the Company’s results of operations, and changes in the Company’s
forecasts or market expectations relating to future results. See “Risk Factors – The market price of the Company’s common shares is
volatile” in the Company’s Annual Information Form.
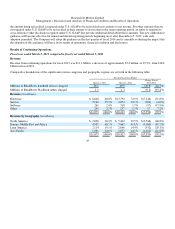
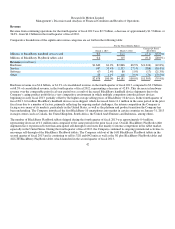
Investment Income
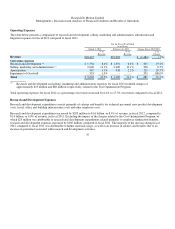
Investment income decreased by $6 million to $15 million in fiscal 2013, from $21 million in fiscal 2012. The decrease in investment
income is the result of decreases in the company’s average yield on its investments, the recording of the Company’s portion of
investment losses in its equity-based investments, and the accrual of interest expenses for other tax matters, offset by a gain on the
sale of the Company’s claim on Lehman Brothers International (Europe) (“LBIE”) trust assets which had previously been impaired in
fiscal 2011. See “Financial Condition - Liquidity and Capital Resources”.
Income Taxes
For fiscal 2013, the Company’s income tax recovery from continuing operations was $592 million, resulting in an effective income
tax recovery rate of approximately 48.5%, compared to income tax expense of $347 million and an effective income tax rate of
approximately 22.9% for the prior fiscal year. The Company’s effective income tax recovery rate reflects the geographic mix of
earnings in jurisdictions with different income tax rates. The higher effective income tax recovery rate in fiscal 2013 primarily reflects
the favourable impacts of the $152 million effective settlement of uncertain income tax positions in the third quarter of fiscal 2013
that resulted from prior restructuring of the Company’s international operations, carrying operating losses back to prior periods with
higher effective income tax rates and the effect of income tax incentives on earnings offset by the unfavourable impact of the Q1
Goodwill Impairment Charge.
32