Blackberry 2013 Annual Report Download - page 196
Download and view the complete annual report
Please find page 196 of the 2013 Blackberry annual report below. You can navigate through the pages in the report by either clicking on the pages listed below, or by using the keyword search tool below to find specific information within the annual report.-
 1
1 -
2
-
3
-
4
-
5
-
6
-
7
-
8
-
9
-
10
-
11
-
12
-
13
-
14
-
15
-
16
-
17
-
18
-
19
-
20
-
21
-
22
-
23
-
24
-
25
-
26
-
27
-
28
-
29
-
30
-
31
-
32
-
33
-
34
-
35
-
36
-
37
-
38
-
39
-
40
-
41
-
42
-
43
-
44
-
45
-
46
-
47
-
48
-
49
-
50
-
51
-
52
-
53
-
54
-
55
-
56
-
57
-
58
-
59
-
60
-
61
-
62
-
63
-
64
-
65
-
66
-
67
-
68
-
69
-
70
-
71
-
72
-
73
-
74
-
75
-
76
-
77
-
78
-
79
-
80
-
81
-
82
-
83
-
84
-
85
-
86
-
87
-
88
-
89
-
90
-
91
-
92
-
93
-
94
-
95
-
96
-
97
-
98
-
99
-
100
-
101
-
102
-
103
-
104
-
105
-
106
-
107
-
108
-
109
-
110
-
111
-
112
-
113
-
114
-
115
-
116
-
117
-
118
-
119
-
120
-
121
-
122
-
123
-
124
-
125
-
126
-
127
-
128
-
129
-
130
-
131
-
132
-
133
-
134
-
135
-
136
-
137
-
138
-
139
-
140
-
141
-
142
-
143
-
144
-
145
-
146
-
147
-
148
-
149
-
150
-
151
-
152
-
153
-
154
-
155
-
156
-
157
-
158
-
159
-
160
-
161
-
162
-
163
-
164
-
165
-
166
-
167
-
168
-
169
-
170
-
171
-
172
-
173
-
174
-
175
-
176
-
177
-
178
-
179
-
180
-
181
-
182
-
183
-
184
-
185
-
 186
186 -
 187
187 -
 188
188 -
 189
189 -
 190
190 -
 191
191 -
 192
192 -
 193
193 -
 194
194 -
 195
195 -
 196
196 -
 197
197 -
 198
198 -
 199
199 -
 200
200 -
 201
201 -
 202
202 -
 203
203 -
 204
204 -
 205
205 -
 206
206 -
207
-
208
-
209
-
210
-
211
-
212
-
213
-
214
-
215
-
216
-
217
-
218
-
219
-
220
-
221
-
222
-
223
-
224
-
225
-
226
-
227
-
228
-
229
-
230
-
231
-
232
-
233
-
234
-
235
 |
 |

Research In Motion Limited
Management’s Discussion and Analysis of Financial Condition and Results of Operations
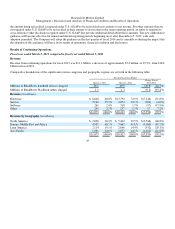
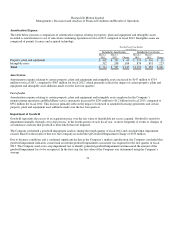
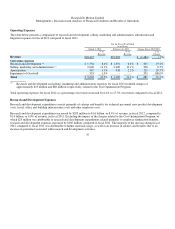
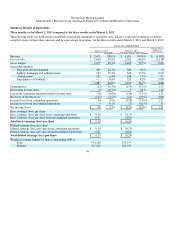
Amortization Expense
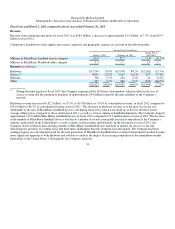
The table below presents a comparison of amortization expense relating to property, plant and equipment and intangible assets
recorded as amortization or cost of sales from continuing operations for fiscal 2013 compared to fiscal 2012. Intangible assets are
comprised of patents, licenses and acquired technology.
A
mortization
Amortization expense relating to certain property, plant and equipment and intangible assets increased by $147 million to $714
million for fiscal 2013, compared to $567 million for fiscal 2012, which primarily reflects the impact of certain property, plant and
equipment and intangible asset additions made over the last four quarters.
Cost of sales
Amortization expense relating to certain property, plant and equipment and intangible assets employed in the Company’s
manufacturing operations and BlackBerry service operations increased by $241 million to $1.2 billion for fiscal 2013, compared to
$952 million for fiscal 2012. This increase primarily reflects the impact of renewed or amended licensing agreements and certain
property, plant and equipment asset additions made over the last four quarters.
Impairment of Goodwill
Goodwill represents the excess of an acquisition price over the fair value of identifiable net assets acquired. Goodwill is tested for
impairment annually, through a two step process, in the fourth quarter of each fiscal year, or more frequently if events or changes in
circumstances indicate that goodwill is more likely than not impaired.
The Company performed a goodwill impairment analysis during the fourth quarter of fiscal 2012 and concluded that impairment
existed. Based on the results of that test, the Company recorded the Q4 Goodwill Impairment Charge of $355 million.
Due to business conditions and a continued significant decline in the Company’s market capitalization, the Company concluded that
goodwill impairment indicators existed and an interim goodwill impairment assessment was required for the first quarter of fiscal
2013. The Company used a two-step impairment test to identify potential goodwill impairment and measured the amount of the
goodwill impairment loss to be recognized. In the first step, the fair value of the Company was determined using the Company’s
average
31
For the Fiscal Year Ended
(in millions)
Included in Amortization Included in Cost of sales
March 2,
2013
March 3,
2012 Change
March 2,
2013
March 3,
2012 Change
Property, plant and equipment
$402 $359 $43 $319 $301 $18
Intan
g
ible assets
312 208 104 874
651
223
Total
$714 $567 $147 $1,193 $952 $241