Blackberry 2013 Annual Report Download - page 175
Download and view the complete annual report
Please find page 175 of the 2013 Blackberry annual report below. You can navigate through the pages in the report by either clicking on the pages listed below, or by using the keyword search tool below to find specific information within the annual report.-
 1
1 -
2
-
3
-
4
-
5
-
6
-
7
-
8
-
9
-
10
-
11
-
12
-
13
-
14
-
15
-
16
-
17
-
18
-
19
-
20
-
21
-
22
-
23
-
24
-
25
-
26
-
27
-
28
-
29
-
30
-
31
-
32
-
33
-
34
-
35
-
36
-
37
-
38
-
39
-
40
-
41
-
42
-
43
-
44
-
45
-
46
-
47
-
48
-
49
-
50
-
51
-
52
-
53
-
54
-
55
-
56
-
57
-
58
-
59
-
60
-
61
-
62
-
63
-
64
-
65
-
66
-
67
-
68
-
69
-
70
-
71
-
72
-
73
-
74
-
75
-
76
-
77
-
78
-
79
-
80
-
81
-
82
-
83
-
84
-
85
-
86
-
87
-
88
-
89
-
90
-
91
-
92
-
93
-
94
-
95
-
96
-
97
-
98
-
99
-
100
-
101
-
102
-
103
-
104
-
105
-
106
-
107
-
108
-
109
-
110
-
111
-
112
-
113
-
114
-
115
-
116
-
117
-
118
-
119
-
120
-
121
-
122
-
123
-
124
-
125
-
126
-
127
-
128
-
129
-
130
-
131
-
132
-
133
-
134
-
135
-
136
-
137
-
138
-
139
-
140
-
141
-
142
-
143
-
144
-
145
-
146
-
147
-
148
-
149
-
150
-
151
-
152
-
153
-
154
-
155
-
156
-
157
-
158
-
159
-
160
-
161
-
162
-
163
-
164
-
 165
165 -
 166
166 -
 167
167 -
 168
168 -
 169
169 -
 170
170 -
 171
171 -
 172
172 -
 173
173 -
 174
174 -
 175
175 -
 176
176 -
 177
177 -
 178
178 -
 179
179 -
 180
180 -
 181
181 -
 182
182 -
 183
183 -
 184
184 -
 185
185 -
186
-
187
-
188
-
189
-
190
-
191
-
192
-
193
-
194
-
195
-
196
-
197
-
198
-
199
-
200
-
201
-
202
-
203
-
204
-
205
-
206
-
207
-
208
-
209
-
210
-
211
-
212
-
213
-
214
-
215
-
216
-
217
-
218
-
219
-
220
-
221
-
222
-
223
-
224
-
225
-
226
-
227
-
228
-
229
-
230
-
231
-
232
-
233
-
234
-
235
 |
 |

Research In Motion Limited
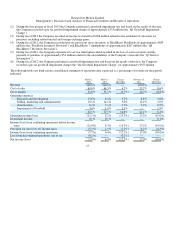
Management’s Discussion and Analysis of Financial Condition and Results of Operations
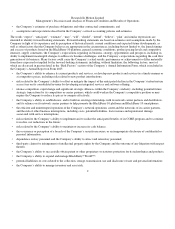
To date, these CORE initiatives have included:
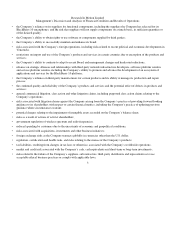
The Company expects to continue to drive cost reductions over the coming fiscal quarters through a continuation of the CORE
program. The Company had initially reported that it expected to incur pre-tax restructuring related charges of approximately $350
million by the end of fiscal 2013; however the Company actually incurred $220 million in pre-tax restructuring costs in fiscal 2013,
primarily associated with the global workforce reduction. Other charges will likely occur as the Company continues to execute on the
CORE program mandate throughout fiscal 2014.
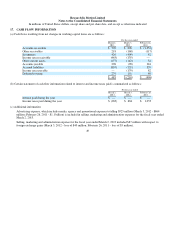
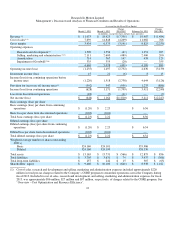
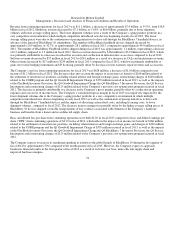
Non-GAAP Financial Measures
As noted above, the Consolidated Financial Statements have been prepared in accordance with U.S. GAAP, and information
contained in this MD&A is presented on that basis. On March 28, 2013, the Company announced financial results for fiscal 2013,
which included certain non-GAAP financial measures, including adjusted net loss from continuing operations and adjusted diluted
loss per share from continuing operations that exclude the impact of pre-tax restructuring charges of $220 million related to the
CORE program, a pre-tax goodwill impairment charge of $335 million and an income tax benefit of $166 million related to the
settlement of uncertain tax positions, including related interest and foreign exchange gains, the Company recorded in fiscal 2013.
Similar non-GAAP financial measures were included in the Company’s presentation of its financial results for the fourth quarter of
fiscal 2013. The term “non-GAAP financial measure” is used to refer to a numerical measure of a company’s historical or future
financial performance, financial position or cash flows that: (i) excludes amounts, or is subject to adjustments that have the effect of
excluding amounts, that are included in the most directly comparable measure calculated and presented in accordance with U.S.
GAAP in a company’s statement of income, balance sheet or statement of cash flows; or (ii) includes amounts, or is subject to
adjustments that have the effect of including amounts, that are excluded from the most directly comparable measure so calculated and
presented. The Company believes that presenting non-GAAP financial measures that exclude the impact of those items enables it and
its shareholders to better assess the Company’s operating performance relative to its consolidated financial results in prior and future
periods and improves the comparability of the information presented. Readers are cautioned that adjusted net loss, adjusted diluted
loss per share and similar measures do not have any standardized meaning prescribed by U.S. GAAP and are therefore unlikely to be
comparable to similarly titled measures reported by other companies. These non-GAAP financial measures should be considered in
the context of the U.S. GAAP results, which are described in this MD&A. A reconciliation of these non-GAAP financial measures to
the most directly comparable U.S. GAAP measures was included in the Company’s press release, dated March 28, 2013.
10
• a global workforce reduction of approximately 5,000 employees. The Company has substantially completed all of its
p
lanned headcount reductions as of March 28, 2013;
• a reduction in the number of layers of management to reduce complexity and drive better clarity, efficiency and
accountabilit
y
across the or
g
anization;
• the continued streamlining of the Company’s supply chain, which include moving from four manufacturing providers to
two and reducin
g
manufacturin
g
sites from ten to four;
• outsourcin
g
the Com
p
an
y
’s
g
lobal re
p
air services and re-en
g
ineerin
g
the Com
p
an
y
’s s
p
are
p
arts
p
rocesses;
• a focus on reducin
g
the Com
p
an
y
’s
p
roduct costs from su
pp
liers;
• targeted use of resources in the Company’s sales and marketing initiatives to more effectively leverage marketing windows
and
p
rioritize marketin
g
efforts and s
p
end in re
g
ions that offer the hi
g
hest o
pp
ortunit
y
and return; and
• further outsourcin
g
of non-core functions as determined durin
g
the im
p
lementation of the CORE
p
ro
g
ram.