Avon 2012 Annual Report Download - page 99
Download and view the complete annual report
Please find page 99 of the 2012 Avon annual report below. You can navigate through the pages in the report by either clicking on the pages listed below, or by using the keyword search tool below to find specific information within the annual report.-
 1
1 -
2
-
3
-
4
-
5
-
6
-
7
-
8
-
9
-
10
-
11
-
12
-
13
-
14
-
15
-
16
-
17
-
18
-
19
-
20
-
21
-
22
-
23
-
24
-
25
-
26
-
27
-
28
-
29
-
30
-
31
-
32
-
33
-
34
-
35
-
36
-
37
-
38
-
39
-
40
-
41
-
42
-
43
-
44
-
45
-
46
-
47
-
48
-
49
-
50
-
51
-
52
-
53
-
54
-
55
-
56
-
57
-
58
-
59
-
60
-
61
-
62
-
63
-
64
-
65
-
66
-
67
-
68
-
69
-
70
-
71
-
72
-
73
-
74
-
75
-
76
-
77
-
78
-
79
-
80
-
81
-
82
-
83
-
84
-
85
-
86
-
87
-
88
-
 89
89 -
 90
90 -
 91
91 -
 92
92 -
 93
93 -
 94
94 -
 95
95 -
 96
96 -
 97
97 -
 98
98 -
 99
99 -
 100
100 -
 101
101 -
 102
102 -
 103
103 -
 104
104 -
 105
105 -
 106
106 -
 107
107 -
 108
108 -
 109
109 -
110
-
111
-
112
-
113
-
114
-
115
-
116
-
117
-
118
-
119
-
120
-
121
 |
 |

NOTES TO CONSOLIDATED FINANCIAL STATEMENTS
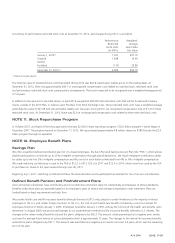
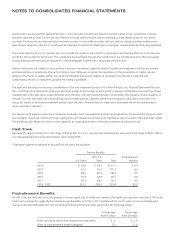
The U.S. pension plans include funded qualified plans and unfunded non-qualified plans. As of December 31, 2012, the U.S. qualified
pension plans had benefit obligations of $728.8 and plan assets of $529.2. As of December 31, 2011, the U.S. qualified pension plans had
benefit obligations of $683.5 and plan assets of $493.4. We believe we have adequate investments and cash flows to fund the liabilities
associated with the unfunded non-qualified plans.
During the second quarter of 2012, approximately $40 of assets previously designated and intended to be used solely for postretirement
benefits were transferred to a trust that funds both active and retiree benefits (the “healthcare trust”). We treated the transfer of these
assets as a negative contribution in our net benefit obligation. At December 31, 2012, the balance in this healthcare trust was $26.9.
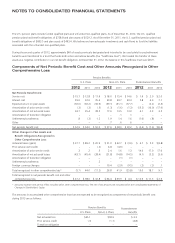
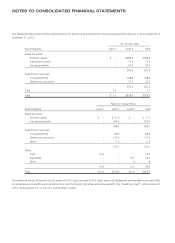
Components of Net Periodic Benefit Cost and Other Amounts Recognized in Other
Comprehensive Loss
Pension Benefits
U.S. Plans Non-U.S. Plans Postretirement Benefits
2012 2011 2010 2012 2011 2010 2012 2011 2010
Net Periodic Benefit Cost:
Service cost $ 15.1 $ 12.8 $ 11.9 $ 18.0 $ 15.4 $ 14.6 $ 1.9 $ 2.0 $ 2.0
Interest cost 29.6 32.6 35.6 39.8 39.7 39.3 5.8 6.4 7.1
Expected return on plan assets (36.0) (36.2) (36.9) (39.1) (41.1) (37.7) – (2.2) (2.4)
Amortization of prior service credit (.3) (.3) (.3) (1.3) (1.6) (1.3) (13.2) (16.0) (17.0)
Amortization of net actuarial losses 43.7 45.4 38.5 17.6 13.5 13.0 4.1 3.2 3.5
Amortization of transition obligation – – – – .1 .1 – – –
Settlements/curtailments .8 (.3) 1.2 1.9 1.4 1.6 (1.0) (.8) –
Other – – – .7 .6 .6 – – –
Net periodic benefit cost $ 52.9 $ 54.0 $ 50.0 $ 37.6 $ 28.0 $ 30.2 $ (2.4) $ (7.4) $(6.8)
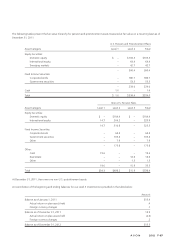
Other Changes in Plan Assets and
Benefit Obligations Recognized in
Other Comprehensive Loss:
Actuarial losses (gains) $ 37.7 $ 89.2 $ 20.9 $ 31.0 $ 62.7 $ (3.0) $ 4.7 $ 5.2 $(3.8)
Prior service cost (credit) – – (.2) 4.8 (4.6) – – – –
Amortization of prior service credit .3 .2 .3 2.4 1.6 1.3 14.6 17.0 17.0
Amortization of net actuarial losses (43.7) (45.4) (38.4) (21.8) (14.8) (14.5) (4.1) (3.2) (3.6)
Amortization of transition obligation – – – – (.1) (.1) – – –
Settlements/curtailments – – .2 – – – – – –
Foreign currency changes – – – 10.4 (2.9) (9.5) (.2) (.3) .1
Total recognized in other comprehensive loss* (5.7) 44.0 (17.2) 26.8 41.9 (25.8) 15.0 18.7 9.7
Total recognized in net periodic benefit cost and other
comprehensive loss $ 47.2 $ 98.0 $ 32.8 $ 64.4 $ 69.9 $ 4.4 $ 12.6 $ 11.3 $ 2.9
* Amounts represent the pre-tax effect included within other comprehensive loss. The net of tax amounts are included within the Consolidated Statements of
Changes in Shareholders’ Equity.
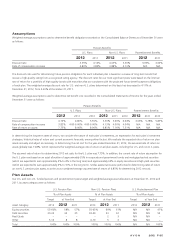
The amounts in accumulated other comprehensive loss that are expected to be recognized as components of net periodic benefit cost
during 2013 are as follows:
Pension Benefits Postretirement
BenefitsU.S. Plans Non-U.S. Plans
Net actuarial loss $45.1 $18.9 $ 3.3
Prior service credit (.3) (1.1) (4.8)
Transition obligation – – –