Avon 2012 Annual Report Download - page 31
Download and view the complete annual report
Please find page 31 of the 2012 Avon annual report below. You can navigate through the pages in the report by either clicking on the pages listed below, or by using the keyword search tool below to find specific information within the annual report.-
 1
1 -
2
-
3
-
4
-
5
-
6
-
7
-
8
-
9
-
10
-
11
-
12
-
13
-
14
-
15
-
16
-
17
-
18
-
19
-
20
-
 21
21 -
 22
22 -
 23
23 -
 24
24 -
 25
25 -
 26
26 -
 27
27 -
 28
28 -
 29
29 -
 30
30 -
 31
31 -
 32
32 -
 33
33 -
 34
34 -
 35
35 -
 36
36 -
 37
37 -
 38
38 -
 39
39 -
 40
40 -
 41
41 -
42
-
43
-
44
-
45
-
46
-
47
-
48
-
49
-
50
-
51
-
52
-
53
-
54
-
55
-
56
-
57
-
58
-
59
-
60
-
61
-
62
-
63
-
64
-
65
-
66
-
67
-
68
-
69
-
70
-
71
-
72
-
73
-
74
-
75
-
76
-
77
-
78
-
79
-
80
-
81
-
82
-
83
-
84
-
85
-
86
-
87
-
88
-
89
-
90
-
91
-
92
-
93
-
94
-
95
-
96
-
97
-
98
-
99
-
100
-
101
-
102
-
103
-
104
-
105
-
106
-
107
-
108
-
109
-
110
-
111
-
112
-
113
-
114
-
115
-
116
-
117
-
118
-
119
-
120
-
121
 |
 |

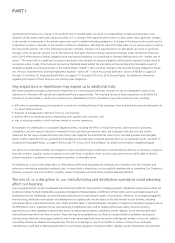
PART II
Performance Metrics
Within this MD&A, in addition to our key financial metrics of revenue, operating profit and operating margin, we utilize the performance
metrics defined below to assist in the evaluation of our business.
Performance Metrics Definition
Growth in Active Representatives This metric is based on the number of orders in a campaign, totaled for all campaigns in the
related period. This amount is divided by the number of billing days in the related period, to
exclude the impact of year-to-year changes in billing days (for example, holiday schedules). To
determine the growth in Active Representatives, this calculation is compared to the same
calculation in the corresponding period of the prior year.
Change in Units This metric is based on the gross number of pieces of merchandise sold during a period, as
compared to the same number in the same period of the prior year. Units sold include
samples sold and products contingent upon the purchase of another product (for example,
gift with purchase or discount purchase with purchase), but exclude free samples.
Inventory Days This metric is equal to the number of days of cost of sales, based on the average of the
preceding 12 months, covered by the inventory balance at the end of the period.
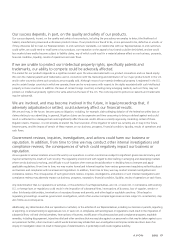
Non-GAAP Financial Measures
To supplement our financial results presented in accordance with generally accepted accounting principles in the United States (“GAAP”),
we disclose operating results that have been adjusted to exclude the impact of changes due to the translation of foreign currencies into U.S.
dollars, including changes in: revenue, operating profit, adjusted Non-GAAP operating profit, operating margin, and adjusted Non-GAAP
operating margin. We refer to these adjusted financial measures as Constant $ items, which are Non-GAAP financial measures. We believe
these measures provide investors an additional perspective on trends. To exclude the impact of changes due to the translation of foreign
currencies into U.S. dollars, we calculate current year results and prior year results at a constant exchange rate. Currency impact is
determined as the difference between actual growth rates and constant currency growth rates.
We also present gross margin, selling, general and administrative expenses as a percentage of revenue, net global expenses, operating profit,
operating margin and effective tax rate on a Non-GAAP basis. The discussion of our segments presents operating profit and operating margin on a
Non-GAAP basis. We have provided a quantitative reconciliation of the difference between the Non-GAAP financial measure and the financial
measure calculated and reported in accordance with GAAP. The Company uses the Non-GAAP financial measures to evaluate its operating
performance and believes that it is meaningful for investors to be made aware of, on a period-to-period basis, the impacts of 1) costs to implement
(“CTI”) restructuring initiatives, 2) the goodwill and intangible assets charges related to Silpada and the goodwill charge related to China (each an
“Impairment charge,” and collectively, “Impairment charges”), 3) costs and charges related to Venezuela being designated as a highly inflationary
economy and the subsequent devaluation of its currency in January 2010, as well as the benefit related to the release of a provision associated
with the excess cost of acquiring U.S. dollars in Venezuela (“Venezuelan special items”), and 4) the additional provision for income taxes as we are
no longer asserting that the undistributed earnings of foreign subsidiaries are indefinitely reinvested (“Special tax items”). The Company believes
investors find the Non-GAAP information helpful in understanding the ongoing performance of operations separate from items that may have a
disproportionate positive or negative impact on the Company’s financial results in any particular period.
The Impairment charges include the impact on the Statement of Income caused by the goodwill and intangible assets impairment charges
related to Silpada in 2012 and 2011 and the goodwill impairment charge related to China in 2012. The Venezuelan special items include the
impact on the Statement of Income caused by the devaluation of the Venezuelan currency on monetary assets and liabilities, such as cash,
receivables and payables; deferred tax assets and liabilities; and nonmonetary assets, such as inventory and prepaid expenses. For
nonmonetary assets, the Venezuelan special items include the earnings impact caused by the difference between the historical cost of the
assets at the previous official exchange rate of 2.15 and the revised official exchange rate of 4.30. The Venezuelan special items also include
the impact on the Statement of Income caused by the release of a provision associated with the excess cost of acquiring U.S. dollars in
Venezuela at the regulated market rate as compared to the official exchange rate. The Special tax items include the impact on the Statement
of Income in 2012 caused by an additional provision for income taxes as we are no longer asserting that the undistributed earnings of
foreign subsidiaries are indefinitely reinvested. During the fourth quarter of 2012, we determined that the Company may repatriate offshore
cash to meet certain domestic funding needs.