Avon 2012 Annual Report Download - page 51
Download and view the complete annual report
Please find page 51 of the 2012 Avon annual report below. You can navigate through the pages in the report by either clicking on the pages listed below, or by using the keyword search tool below to find specific information within the annual report.-
 1
1 -
2
-
3
-
4
-
5
-
6
-
7
-
8
-
9
-
10
-
11
-
12
-
13
-
14
-
15
-
16
-
17
-
18
-
19
-
20
-
21
-
22
-
23
-
24
-
25
-
26
-
27
-
28
-
29
-
30
-
31
-
32
-
33
-
34
-
35
-
36
-
37
-
38
-
39
-
40
-
 41
41 -
 42
42 -
 43
43 -
 44
44 -
 45
45 -
 46
46 -
 47
47 -
 48
48 -
 49
49 -
 50
50 -
 51
51 -
 52
52 -
 53
53 -
 54
54 -
 55
55 -
 56
56 -
 57
57 -
 58
58 -
 59
59 -
 60
60 -
 61
61 -
62
-
63
-
64
-
65
-
66
-
67
-
68
-
69
-
70
-
71
-
72
-
73
-
74
-
75
-
76
-
77
-
78
-
79
-
80
-
81
-
82
-
83
-
84
-
85
-
86
-
87
-
88
-
89
-
90
-
91
-
92
-
93
-
94
-
95
-
96
-
97
-
98
-
99
-
100
-
101
-
102
-
103
-
104
-
105
-
106
-
107
-
108
-
109
-
110
-
111
-
112
-
113
-
114
-
115
-
116
-
117
-
118
-
119
-
120
-
121
 |
 |

PART II
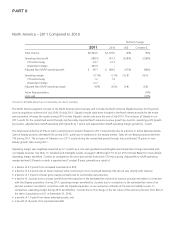
We maintain defined benefit pension plans and unfunded supplemental pension benefit plans (see Note 12, Employee Benefit Plans, on
pages F-31 through F-39 of our 2012 Annual Report). Our funding policy for these plans is based on legal requirements and available cash
flows. The amounts necessary to fund future obligations under these plans could vary depending on estimated assumptions (as detailed in
the “Critical Accounting Estimates” section of this MD&A). The future funding for these plans will depend on economic conditions,
employee demographics, mortality rates, the number of associates electing to take lump-sum distributions, investment performance and
funding decisions. Based on current assumptions, we expect to make contributions in the range of $55 to $60 to our U.S. pension and
postretirement plans and in the range of $40 to $45 to our international pension and postretirement plans during 2013.
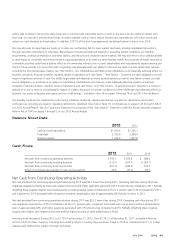
Net Cash from Continuing Investing Activities
Net cash used by continuing investing activities during 2012 was $54.0 lower than during 2011 primarily due to lower capital expenditures.
Net cash used by continuing investing activities during 2011 was $828.0 lower than during 2010, primarily due to the acquisitions of Silpada
and Liz Earle in 2010, as well as lower capital expenditures.
Capital expenditures during 2012 were $228.8 compared with $276.7 during 2011, as 2011 included higher investment associated with
new distribution facilities in Latin America. Capital expenditures during 2011 were $276.7 compared with $331.2 during 2010, as 2010
included higher investment associated with new distribution facilities in Latin America. Capital expenditures in 2013 are currently expected
to be approximately $310 to $340 and are expected to be be funded by cash from operations.
Net Cash from Continuing Financing Activities
Net cash used by continuing financing activities during 2012 was $401.3 compared with $284.5 in 2011, primarily due to lower issuances of
commercial paper, and was partially offset by the proceeds of $550.0 related to the term loan agreement entered into during 2012, the
scheduled repayment of $500.0 principal amount of notes in 2011, lower dividend payments in 2012, and proceeds of $43.6 related to the
termination of two of our interest-rate swap agreements designated as fair value hedges. See Note 8, Financial Instruments and Risk
Management, on pages F-22 through F-26 of our 2012 Annual Report for more details.
Net cash used by continuing financing activities of $284.5 during 2011 compared unfavorably to cash provided by continuing financing
activities of $234.7 during 2010 primarily due to the issuance of debt in 2010 to partially finance the Silpada acquisition.
We purchased approximately .5 million shares of our common stock for $8.8 during 2012, as compared to .4 million shares of our common
stock for $7.7 during 2011 and .4 million shares for $14.1 during 2010, under our previously announced share repurchase programs and
through acquisition of stock from employees in connection with tax payments upon vesting of restricted stock units.
As part of an overall review of our capital structure, on November 1, 2012, we announced a decrease in the quarterly dividend to $.06 per
share, for the fourth-quarter dividend paid in December 2012. We have maintained the dividend of $.06 for the first quarter of 2013.
During the full year 2011 and the first nine months of 2012 our quarterly dividend payments were $.23 per share.
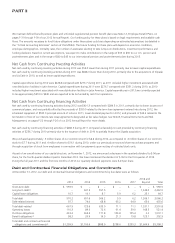
Debt and Contractual Financial Obligations and Commitments
At December 31, 2012, our debt and contractual financial obligations and commitments by due dates were as follows:
2013 2014 2015 2016 2017
2018 and
Beyond Total
Short-term debt $ 559.5 $ – $ – $ – $ – $ – $ 559.5
Long-term debt(3) – 641.5 557.5 – – 1,243.0 2,442.0
Capital lease obligations 10.7 10.1 8.7 5.9 6.2 23.1 64.7
Total debt 570.2 651.6 566.2 5.9 6.2 1,266.1 3,066.2
Debt-related interest 97.7 74.0 68.8 65.2 64.9 65.0 435.6
Total debt-related 667.9 725.6 635.0 71.1 71.1 1,331.1 3,501.8
Operating leases 110.3 89.6 72.6 61.4 39.0 148.5 521.4
Purchase obligations 423.4 264.5 171.8 104.8 105.4 2.2 1,072.1
Benefit obligations(1) 98.3 20.9 19.5 21.3 19.8 123.1 302.9
Total debt and contractual financial
obligations and commitments(2) $1,299.9 $1,100.6 $898.9 $258.6 $235.3 $1,604.9 $5,398.2