Avon 2012 Annual Report Download - page 32
Download and view the complete annual report
Please find page 32 of the 2012 Avon annual report below. You can navigate through the pages in the report by either clicking on the pages listed below, or by using the keyword search tool below to find specific information within the annual report.-
 1
1 -
2
-
3
-
4
-
5
-
6
-
7
-
8
-
9
-
10
-
11
-
12
-
13
-
14
-
15
-
16
-
17
-
18
-
19
-
20
-
21
-
 22
22 -
 23
23 -
 24
24 -
 25
25 -
 26
26 -
 27
27 -
 28
28 -
 29
29 -
 30
30 -
 31
31 -
 32
32 -
 33
33 -
 34
34 -
 35
35 -
 36
36 -
 37
37 -
 38
38 -
 39
39 -
 40
40 -
 41
41 -
 42
42 -
43
-
44
-
45
-
46
-
47
-
48
-
49
-
50
-
51
-
52
-
53
-
54
-
55
-
56
-
57
-
58
-
59
-
60
-
61
-
62
-
63
-
64
-
65
-
66
-
67
-
68
-
69
-
70
-
71
-
72
-
73
-
74
-
75
-
76
-
77
-
78
-
79
-
80
-
81
-
82
-
83
-
84
-
85
-
86
-
87
-
88
-
89
-
90
-
91
-
92
-
93
-
94
-
95
-
96
-
97
-
98
-
99
-
100
-
101
-
102
-
103
-
104
-
105
-
106
-
107
-
108
-
109
-
110
-
111
-
112
-
113
-
114
-
115
-
116
-
117
-
118
-
119
-
120
-
121
 |
 |
See Note 15, Restructuring Initiatives on pages F-42 through F-46 of our 2012 Annual Report, Note 17, Goodwill and Intangible Assets on
pages F-48 through F-51 of our 2012 Annual Report, the “Segment Review – Latin America” section below, and Note 7, Income Taxes on
pages F-19 through F-22 of our 2012 Annual Report for more information on these items.
These Non-GAAP measures should not be considered in isolation, or as a substitute for, or superior to, financial measures calculated in
accordance with GAAP.
Critical Accounting Estimates
We believe the accounting policies described below represent our critical accounting policies due to the estimation processes involved in
each. See Note 1, Description of the Business and Summary of Significant Accounting Policies, on pages F-8 through F-14 of our 2012
Annual Report for a detailed discussion of the application of these and other accounting policies.
Restructuring Reserves
We record the estimated expense for our restructuring initiatives when such costs are deemed probable and estimable, when approved by
the appropriate corporate authority and by accumulating detailed estimates of costs for such plans. These expenses include the estimated
costs of employee severance and related benefits, impairment or accelerated depreciation of property, plant and equipment, and any other
qualifying exit costs. These estimated costs are grouped by specific projects within the overall plan and are then monitored on a quarterly
basis by finance personnel. Such costs represent our best estimate, but require assumptions about the programs that may change over time,
including attrition rates. Estimates are evaluated periodically to determine whether an adjustment is required.
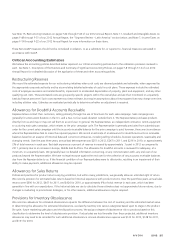
Allowances for Doubtful Accounts Receivable
Representatives contact their customers, selling primarily through the use of brochures for each sales campaign. Sales campaigns are
generally for a two-week duration in the U.S. and a two- to four-week duration outside the U.S. The Representative purchases products
directly from us and may or may not sell them to an end user. In general, the Representative, an independent contractor, remits a payment
to us during each sales campaign, which relates to the prior campaign cycle. The Representative is generally precluded from submitting an
order for the current sales campaign until the accounts receivable balance for the prior campaign is paid; however, there are circumstances
where the Representative fails to make the required payment. We record an estimate of an allowance for doubtful accounts on receivable
balances based on an analysis of historical data and current circumstances, including selling schedules, business operations, seasonality and
changing trends. Over the past three years, annual bad debt expense was $251 in 2012, $247 in 2011, and $216 in 2010, or approximately
2% of total revenue in each year. Bad debt expense as a percent of revenue increased by approximately .1 point in 2012 as compared to
2011, primarily due to an increase in Europe, Middle East & Africa. The allowance for doubtful accounts is reviewed for adequacy, at a
minimum, on a quarterly basis. We generally have no detailed information concerning, or any communication with, any end user of our
products beyond the Representative. We have no legal recourse against the end user for the collection of any accounts receivable balances
due from the Representative to us. If the financial condition of our Representatives were to deteriorate, resulting in an impairment of their
ability to make payments, additional allowances may be required.
Allowances for Sales Returns
Policies and practices for product returns vary by jurisdiction, but within many jurisdictions, we generally allow an unlimited right of return.
We record a provision for estimated sales returns based on historical experience with product returns. Over the past three years, annual sales
returns were $390 for 2012, $447 for 2011, and $424 for 2010, or approximately 4% of total revenue in each year, which has been
generally in line with our expectations. If the historical data we use to calculate these estimates does not approximate future returns, due to
changes in marketing or promotional strategies, or for other reasons, additional allowances may be required.
Provisions for Inventory Obsolescence
We record an allowance for estimated obsolescence equal to the difference between the cost of inventory and the estimated market value.
In determining the allowance for estimated obsolescence, we classify inventory into various categories based upon its stage in the product
life cycle, future marketing sales plans and the disposition process. We assign a degree of obsolescence risk to products based on this
classification to determine the level of obsolescence provision. If actual sales are less favorable than those projected, additional inventory
allowances may need to be recorded for such additional obsolescence. Annual obsolescence expense was $122 for 2012, $128 for 2011,
and $131 for 2010.
A V O N 2012 25