Avon 2012 Annual Report Download - page 100
Download and view the complete annual report
Please find page 100 of the 2012 Avon annual report below. You can navigate through the pages in the report by either clicking on the pages listed below, or by using the keyword search tool below to find specific information within the annual report.-
 1
1 -
2
-
3
-
4
-
5
-
6
-
7
-
8
-
9
-
10
-
11
-
12
-
13
-
14
-
15
-
16
-
17
-
18
-
19
-
20
-
21
-
22
-
23
-
24
-
25
-
26
-
27
-
28
-
29
-
30
-
31
-
32
-
33
-
34
-
35
-
36
-
37
-
38
-
39
-
40
-
41
-
42
-
43
-
44
-
45
-
46
-
47
-
48
-
49
-
50
-
51
-
52
-
53
-
54
-
55
-
56
-
57
-
58
-
59
-
60
-
61
-
62
-
63
-
64
-
65
-
66
-
67
-
68
-
69
-
70
-
71
-
72
-
73
-
74
-
75
-
76
-
77
-
78
-
79
-
80
-
81
-
82
-
83
-
84
-
85
-
86
-
87
-
88
-
89
-
 90
90 -
 91
91 -
 92
92 -
 93
93 -
 94
94 -
 95
95 -
 96
96 -
 97
97 -
 98
98 -
 99
99 -
 100
100 -
 101
101 -
 102
102 -
 103
103 -
 104
104 -
 105
105 -
 106
106 -
 107
107 -
 108
108 -
 109
109 -
 110
110 -
111
-
112
-
113
-
114
-
115
-
116
-
117
-
118
-
119
-
120
-
121
 |
 |

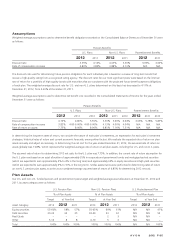
Assumptions
Weighted-average assumptions used to determine benefit obligations recorded on the Consolidated Balance Sheets as of December 31 were
as follows:
Pension Benefits
U.S. Plans Non-U.S. Plans Postretirement Benefits
2012 2011 2012 2011 2012 2011
Discount rate 3.55% 4.10% 4.63% 5.30% 3.99% 4.66%
Rate of compensation increase 3.86% 3.82% 3.88% 4.13% N/A N/A
The discount rate used for determining future pension obligations for each individual plan is based on a review of long-term bonds that
receive a high-quality rating from a recognized rating agency. The discount rates for our most significant plans were based on the internal
rate of return for a portfolio of high-quality bonds with maturities that are consistent with the projected future benefit payment obligations
of each plan. The weighted-average discount rate for U.S. and non-U.S. plans determined on this basis has decreased to 4.11% at
December 31, 2012, from 4.69% at December 31, 2011.
Weighted-average assumptions used to determine net benefit cost recorded in the Consolidated Statements of Income for the years ended
December 31 were as follows:
Pension Benefits
U.S. Plans Non-U.S. Plans Postretirement Benefits
2012 2011 2010 2012 2011 2010 2012 2011 2010
Discount rate 4.10% 4.80% 5.35% 5.30% 5.60% 6.04% 4.66% 5.28% 5.83%
Rate of compensation increase 3.82% 4.00-6.00% 4.00-6.00% 4.13% 4.00% 4.04% N/A N/A N/A
Rate of return on assets 7.75% 8.00% 8.00% 6.85% 7.16% 7.31% N/A N/A N/A
In determining the long-term rates of return, we consider the nature of each plan’s investments, an expectation for each plan’s investment
strategies, historical rates of return and current economic forecasts, among other factors. We evaluate the expected rate of return on plan
assets annually and adjust as necessary. In determining the net cost for the year ended December 31, 2012, the assumed rate of return on
assets globally was 7.28%, which represents the weighted-average rate of return on all plan assets, including the U.S. and non-U.S. plans.
The assumed rate of return for determining 2012 net costs for the U.S. plan was 7.75%. In addition, the current rate of return assumption for
the U.S. plan was based on an asset allocation of approximately 35% in corporate and government bonds and mortgage-backed securities
(which are expected to earn approximately 2% to 4% in the long term) and approximately 65% in equity securities and high yield securities
(which are expected to earn approximately 6% to 10% in the long term). Similar assessments were performed in determining rates of return
on non-U.S. pension plan assets, to arrive at our weighted-average assumed rate of return of 6.85% for determining 2012 net cost.
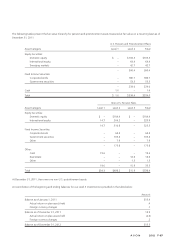
Plan Assets
Our U.S. and non-U.S. funded pension and postretirement plans target and weighted-average asset allocations at December 31, 2012 and
2011, by asset category were as follows:
U.S. Pension Plan Non-U.S. Pension Plans U.S. Postretirement Plan
% of Plan Assets % of Plan Assets % of Plan Assets
Target at Year End Target at Year End Target at Year End
Asset Category 2013 2012 2011 2013 2012 2011 2013 2012 2011
Equity securities 55-60% 58% 57% 55-65% 60% 61% N/A N/A 47%
Debt securities 30-35 34 35 30-40 33 32 N/A N/A 53
Real Estate – – – – 2 3 N/A N/A –
Other 5-10 8 8 0-10 5 4 N/A N/A –
Total 100% 100% 100% 100% 100% 100% N/A N/A 100%
A V O N 2012 F-35