Avon 2012 Annual Report Download - page 43
Download and view the complete annual report
Please find page 43 of the 2012 Avon annual report below. You can navigate through the pages in the report by either clicking on the pages listed below, or by using the keyword search tool below to find specific information within the annual report.
PART II
position, approximately $172 was associated with Bolívar-denominated monetary net assets and deferred income taxes. Additionally, during
2012 Avon Venezuela represented approximately 5% of Avon’s consolidated revenue, 14% of Avon’s consolidated operating profit, and
7% of Avon’s consolidated adjusted Non-GAAP operating profit. During 2012 and 2011, costs associated with acquiring goods that
required settlement in U.S. dollars included within Venezuela’s operating profit were approximately $18 and $17, respectively.
At December 31, 2012, Avon Venezuela had pending requests submitted with an agency of the Venezuelan government for approximately
$80 for remittance of dividends and royalties to its parent company in the U.S. These outstanding requests had been periodically submitted
between 2005 and 2012.
Effective February 13, 2013, the Venezuelan government devalued its currency by approximately 32%. The official exchange rate moved
from 4.30 to 6.30 and the regulated SITME market was eliminated. As a result of the change in the official rate to 6.30, based on a
preliminary analysis, Avon anticipates it will record a one-time, after-tax loss of approximately $50 (approximately $34 in “Other expense,
net” and approximately $16 in “Income taxes”) in the first quarter of 2013, primarily reflecting the write-down of monetary assets and
liabilities and deferred tax benefits. Additionally, certain nonmonetary assets are carried at the U.S. historic dollar cost subsequent to the
devaluation. Therefore, these costs will impact the income statement during 2013 at a disproportionate rate as they will not be devalued
based on the new exchange rates, but will be expensed at the historic dollar value. As a result of using the U.S. historic dollar cost basis of
nonmonetary assets, such as inventory, acquired prior to the devaluation, 2013 operating profit and net income will be negatively impacted
by approximately $50, primarily during the first half of the year, for the difference between the historical cost at the previous official
exchange rate of 4.30 and the new official exchange rate of 6.30. In addition, revenue and operating profit for Avon’s Venezuela operations
will be negatively impacted when translated into dollars at the new official exchange rate. This could be partially offset by the favorable
impact of any operating performance improvements. Results for periods prior to 2013 will not be impacted by the change in the official rate
in February of 2013.
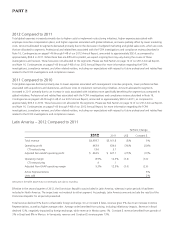
Latin America – 2011 Compared to 2010
%/Point Change
2011 2010 US$ Constant $
Total revenue $5,161.8 $4,640.0 11% 8%
Operating profit 634.0 613.3 3% (13)%
CTI restructuring 3.1 19.8
Venezuelan special items – 79.5
Adjusted Non-GAAP operating profit $ 637.1 $ 712.6 (11)% (23)%
Operating margin 12.3% 13.2% (.9) (2.8)
CTI restructuring .1 .4
Venezuelan special items – 1.7
Adjusted Non-GAAP operating margin 12.3% 15.4% (3.1) (4.9)
Active Representatives 2%
Units sold 1%
Amounts in the table above may not necessarily sum due to rounding.
Total revenue during 2011 increased 11% due to higher average order and growth in Active Representatives, as well as due to favorable
foreign exchange. Average order benefited from the favorable impacts of pricing while Active Representatives growth benefited from
continued investments in RVP. During 2011, revenue grew 6% in Brazil and 17% in Mexico, with benefits from favorable foreign exchange.
Constant $ revenue during 2011 increased 8%, benefiting from continued growth in most markets, particularly from growth of 14% in
Mexico. Constant $ revenue in Brazil was relatively flat. In Venezuela, revenue and Constant $ revenue during 2011 grew 28%.
Brazil’s performance during 2011 continued to be pressured by lower than normal service levels. In addition, lower than normal service levels
were further impacted by the implementation of an ERP system during the second half of the year, which in turn has negatively impacted
average order, Active Representatives, and revenue growth. Additionally, slowing Beauty category market growth pressured Brazil’s results in


