Avon 2012 Annual Report Download - page 40
Download and view the complete annual report
Please find page 40 of the 2012 Avon annual report below. You can navigate through the pages in the report by either clicking on the pages listed below, or by using the keyword search tool below to find specific information within the annual report.-
 1
1 -
2
-
3
-
4
-
5
-
6
-
7
-
8
-
9
-
10
-
11
-
12
-
13
-
14
-
15
-
16
-
17
-
18
-
19
-
20
-
21
-
22
-
23
-
24
-
25
-
26
-
27
-
28
-
29
-
 30
30 -
 31
31 -
 32
32 -
 33
33 -
 34
34 -
 35
35 -
 36
36 -
 37
37 -
 38
38 -
 39
39 -
 40
40 -
 41
41 -
 42
42 -
 43
43 -
 44
44 -
 45
45 -
 46
46 -
 47
47 -
 48
48 -
 49
49 -
 50
50 -
51
-
52
-
53
-
54
-
55
-
56
-
57
-
58
-
59
-
60
-
61
-
62
-
63
-
64
-
65
-
66
-
67
-
68
-
69
-
70
-
71
-
72
-
73
-
74
-
75
-
76
-
77
-
78
-
79
-
80
-
81
-
82
-
83
-
84
-
85
-
86
-
87
-
88
-
89
-
90
-
91
-
92
-
93
-
94
-
95
-
96
-
97
-
98
-
99
-
100
-
101
-
102
-
103
-
104
-
105
-
106
-
107
-
108
-
109
-
110
-
111
-
112
-
113
-
114
-
115
-
116
-
117
-
118
-
119
-
120
-
121
 |
 |

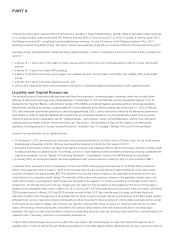
Effective Tax Rate
The effective tax rate for 2011 was 29.1%, compared to 37.0% for 2010.
The effective tax rate for 2011 included tax benefits from audit settlements and statute expirations, which favorably impacted the tax rate by
3.1 points. In addition, the 2011 tax rate was favorably impacted by 2.0 points from the tax benefit on the non-cash impairment charge
associated with our Silpada business.
The effective tax rate for 2010 was unfavorably impacted by 5.6 points due to the devaluation of the Venezuelan currency in conjunction
with highly inflationary accounting discussed further within the Latin America segment review, partially offset by 2.1 points associated with
benefits from audit settlements and statute expirations.
Segment Review
Effective in the second quarter of 2012, the results of Central & Eastern Europe and Western Europe, Middle East & Africa were managed as
a single operating segment. Accordingly, Europe, Middle East & Africa amounts include the results of Central & Eastern Europe and Western
Europe, Middle East & Africa for all periods presented.
Effective in the second quarter of 2012, the Dominican Republic was included in Latin America whereas in prior periods it had been included
in North America. The impact was not material to either segment. Accordingly, the Dominican Republic is included in Latin America and
excluded from North America for all periods presented.
Below is an analysis of the key factors affecting revenue and operating profit by reportable segment for each of the years in the three-year
period ended December 31, 2012.
Years ended December 31 2012 2011 2010
Total
Revenue
Operating
Profit (Loss)
Total
Revenue
Operating
Profit (Loss)
Total
Revenue
Operating
Profit
Latin America $ 4,993.7 $ 443.9 $ 5,161.8 $ 634.0 $ 4,640.0 $ 613.3
Europe, Middle East & Africa 2,914.2 312.8 3,122.8 478.9 3,047.9 474.3
North America 1,906.8 (214.9) 2,064.6 (188.0) 2,193.5 147.3
Asia Pacific 902.4 5.1 942.4 81.4 981.4 82.6
Total from operations 10,717.1 546.9 11,291.6 1,006.3 10,862.8 1,317.5
Global and other expenses – (232.1) – (151.7) – (244.4)
Total $10,717.1 $ 314.8 $11,291.6 $ 854.6 $10,862.8 $1,073.1
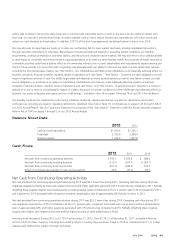
Global and Other Expenses
Global and other expenses include, among other things, costs related to our executive and administrative offices, information technology,
research and development, marketing, and professional and related fees associated with the FCPA investigations and compliance reviews.
We allocate certain planned global expenses to our business segments primarily based on planned revenue. The unallocated costs remain as
Global and other expenses. We do not allocate to our segments costs of implementing restructuring initiatives related to our global
functions or professional and related fees associated with the FCPA investigations and compliance reviews. Costs of implementing
restructuring initiatives related to a specific segment are recorded within that segment.
2012 2011 % Change 2011 2010 % Change
Total global expenses $ 706.3 $ 651.1 8% $ 651.1 $ 713.6 (9)%
Allocated to segments (474.2) (499.4) (5)% (499.4) (469.2) 6%
Net global expenses $ 232.1 $ 151.7 53% $ 151.7 $ 244.4 (38)%
CTI restructuring 44.6 7.2 7.2 13.6
Adjusted Non-GAAP net global expenses $ 187.5 $ 144.5 30% $ 144.5 $ 230.8 (37)%
Amounts in the table above may not necessarily sum due to rounding.
A V O N 2012 33