Avon 2012 Annual Report Download - page 78
Download and view the complete annual report
Please find page 78 of the 2012 Avon annual report below. You can navigate through the pages in the report by either clicking on the pages listed below, or by using the keyword search tool below to find specific information within the annual report.-
 1
1 -
2
-
3
-
4
-
5
-
6
-
7
-
8
-
9
-
10
-
11
-
12
-
13
-
14
-
15
-
16
-
17
-
18
-
19
-
20
-
21
-
22
-
23
-
24
-
25
-
26
-
27
-
28
-
29
-
30
-
31
-
32
-
33
-
34
-
35
-
36
-
37
-
38
-
39
-
40
-
41
-
42
-
43
-
44
-
45
-
46
-
47
-
48
-
49
-
50
-
51
-
52
-
53
-
54
-
55
-
56
-
57
-
58
-
59
-
60
-
61
-
62
-
63
-
64
-
65
-
66
-
67
-
 68
68 -
 69
69 -
 70
70 -
 71
71 -
 72
72 -
 73
73 -
 74
74 -
 75
75 -
 76
76 -
 77
77 -
 78
78 -
 79
79 -
 80
80 -
 81
81 -
 82
82 -
 83
83 -
 84
84 -
 85
85 -
 86
86 -
 87
87 -
 88
88 -
89
-
90
-
91
-
92
-
93
-
94
-
95
-
96
-
97
-
98
-
99
-
100
-
101
-
102
-
103
-
104
-
105
-
106
-
107
-
108
-
109
-
110
-
111
-
112
-
113
-
114
-
115
-
116
-
117
-
118
-
119
-
120
-
121
 |
 |

2011 by approximately $14. We evaluated the total out-of-period adjustments impacting 2011 of approximately $23, both individually and
in the aggregate, in relation to the quarterly and annual periods in which they originated and the annual period in which they were
corrected, and concluded that these adjustments were not material to the consolidated annual financial statements for all impacted periods.
See Note 19, Results of Operations by Quarter (Unaudited), for discussion of these and other out-of-period adjustments within 2012 and
2011 and their impact on the interim periods.
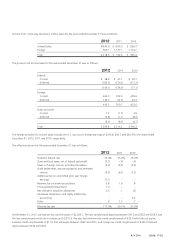
(Loss) Earnings per Share
We compute (loss) earnings per share (“EPS”) using the two-class method, which is a (loss) earnings allocation formula that determines (loss)
earnings per share for common stock and participating securities. Our participating securities are our grants of restricted stock and restricted
stock units, which contain non-forfeitable rights to dividend equivalents. We compute basic EPS by dividing net income allocated to
common shareholders by the weighted-average number of shares outstanding during the year. Diluted EPS is calculated to give effect to all
potentially dilutive common shares that were outstanding during the year.
For each of the three years ended December 31, the components of basic and diluted EPS were as follows:
(Shares in millions) 2012 2011 2010
Numerator from continuing operations
(Loss) income from continuing operations less amounts attributable to
noncontrolling interests $ (42.5) $522.2 $590.9
Less: Loss (earnings) allocated to participating securities .3 (4.6) (4.8)
(Loss) income from continuing operations allocated to common shareholders (42.2) 517.6 586.1
Numerator from discontinued operations
(Loss) income from discontinued operations plus/less amounts attributable to
noncontrolling interests $ – $ (8.6) $ 15.4
Less: Earnings allocated to participating securities – (.9) (.4)
(Loss) income allocated to common shareholders – (9.5) 15.0
Numerator attributable to Avon
(Loss) income attributable to Avon less amounts attributable to noncontrolling
interests $ (42.5) $513.6 $606.3
Less: Loss (earnings) allocated to participating securities .3 (5.5) (5.2)
(Loss) income allocated to common shareholders (42.2) 508.1 601.1
Denominator:
Basic EPS weighted-average shares outstanding 431.9 430.5 428.8
Diluted effect of assumed conversion of stock options – 1.6 2.6
Diluted EPS adjusted weighted-average shares outstanding 431.9 432.1 431.4
(Loss) Earnings per Common Share from continuing operations:
Basic $ (.10) $ 1.20 $ 1.37
Diluted $ (.10) $ 1.20 $ 1.36
(Loss) Earnings per Common Share from discontinued operations:
Basic $ – $ (.02) $ .04
Diluted $ – $ (.02) $ .03
(Loss) Earnings per Common Share attributable to Avon:
Basic $ (.10) $ 1.18 $ 1.40
Diluted $ (.10) $ 1.18 $ 1.39
A V O N 2012 F-13