Avon 2012 Annual Report Download - page 48
Download and view the complete annual report
Please find page 48 of the 2012 Avon annual report below. You can navigate through the pages in the report by either clicking on the pages listed below, or by using the keyword search tool below to find specific information within the annual report.-
 1
1 -
2
-
3
-
4
-
5
-
6
-
7
-
8
-
9
-
10
-
11
-
12
-
13
-
14
-
15
-
16
-
17
-
18
-
19
-
20
-
21
-
22
-
23
-
24
-
25
-
26
-
27
-
28
-
29
-
30
-
31
-
32
-
33
-
34
-
35
-
36
-
37
-
 38
38 -
 39
39 -
 40
40 -
 41
41 -
 42
42 -
 43
43 -
 44
44 -
 45
45 -
 46
46 -
 47
47 -
 48
48 -
 49
49 -
 50
50 -
 51
51 -
 52
52 -
 53
53 -
 54
54 -
 55
55 -
 56
56 -
 57
57 -
 58
58 -
59
-
60
-
61
-
62
-
63
-
64
-
65
-
66
-
67
-
68
-
69
-
70
-
71
-
72
-
73
-
74
-
75
-
76
-
77
-
78
-
79
-
80
-
81
-
82
-
83
-
84
-
85
-
86
-
87
-
88
-
89
-
90
-
91
-
92
-
93
-
94
-
95
-
96
-
97
-
98
-
99
-
100
-
101
-
102
-
103
-
104
-
105
-
106
-
107
-
108
-
109
-
110
-
111
-
112
-
113
-
114
-
115
-
116
-
117
-
118
-
119
-
120
-
121
 |
 |

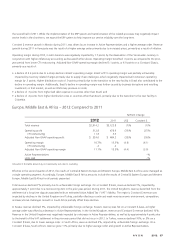
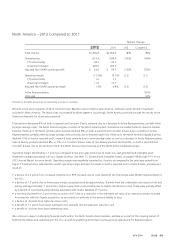
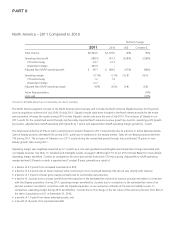
Asia Pacific – 2012 Compared to 2011
%/Point Change
2012 2011 US$ Constant $
Total revenue $902.4 $942.4 (4)% (5)%
Operating profit 5.1 81.4 (94)% (95)%
CTI restructuring 18.2 (.3)
Impairment charge 44.0 –
Adjusted Non-GAAP operating profit $ 67.3 $ 81.1 (17)% (19)%
Operating margin .6% 8.6% (8.0) (8.2)
CTI restructuring 2.0 –
Impairment charge 4.9 –
Adjusted Non-GAAP operating margin 7.5% 8.6% (1.1) (1.3)
Active Representatives (9)%
Units sold (7)%
Amounts in the table above may not necessarily sum due to rounding.
Total revenue declined 4%, or 5% on a Constant $ basis, primarily due to the unfavorable results of our China operations. The decline in the
region’s Active Representatives was primarily due to China. Active Representatives, excluding China, declined 1%. As previously disclosed,
our business in China is predominantly retail. We do not believe including China within the Growth in Active Representatives calculation for
the segment provides for a relevant indicator of underlying business trends. During the second half of 2012, we began receiving from
Beauty Boutiques, independently owned retail stores selling Avon products in China, consolidated orders that were previously received as
multiple orders and counted as such in our Growth in Active Representatives calculation. Revenue in China declined 22%, or 24% in
Constant $, due to declines in unit sales resulting from continuing weak performance in that market. Revenue in the Philippines grew 7%,
or 4% in Constant $, driven by growth in Active Representatives.
Operating margin was negatively impacted by 4.9 points by a non-cash goodwill impairment charge associated with our China business. See
Note 17, Goodwill and Intangible Assets, on pages F-48 through F-51 of our 2012 Annual Report for more details. Operating margin was
also negatively impacted by 2.0 points as compared to the prior-year period from higher CTI restructuring. Adjusted Non-GAAP operating
margin declined 1.1 points, or 1.3 points on a Constant $ basis, primarily as a result of:
• a decline of 1.1 points due to lower gross margin caused primarily by .7 points from the unfavorable net impact of mix and higher pricing
primarily due to weakness in skincare;
• a decline of 1.2 points due to wage inflation outpacing revenue growth, partially offset by restructuring savings; and
• a benefit of 1.0 point from lower investments in RVP, primarily due to China as we transition to a retail compensation model in that
market.
Asia Pacific – 2011 Compared to 2010
%/Point Change
2011 2010 US$ Constant $
Total revenue $942.4 $981.4 (4)% (9)%
Operating profit 81.4 82.6 (1)% (13)%
CTI restructuring (.3) (.3)
Adjusted Non-GAAP operating profit $ 81.1 $ 82.3 (1)% (13)%
Operating margin 8.6% 8.4% .2 (.3)
CTI restructuring – –
Adjusted Non-GAAP operating margin 8.6% 8.4% .2 (.3)
Active Representatives (11)%
Units sold (9)%
Amounts in the table above may not necessarily sum due to rounding.
A V O N 2012 41