Avon 2012 Annual Report Download - page 101
Download and view the complete annual report
Please find page 101 of the 2012 Avon annual report below. You can navigate through the pages in the report by either clicking on the pages listed below, or by using the keyword search tool below to find specific information within the annual report.-
 1
1 -
2
-
3
-
4
-
5
-
6
-
7
-
8
-
9
-
10
-
11
-
12
-
13
-
14
-
15
-
16
-
17
-
18
-
19
-
20
-
21
-
22
-
23
-
24
-
25
-
26
-
27
-
28
-
29
-
30
-
31
-
32
-
33
-
34
-
35
-
36
-
37
-
38
-
39
-
40
-
41
-
42
-
43
-
44
-
45
-
46
-
47
-
48
-
49
-
50
-
51
-
52
-
53
-
54
-
55
-
56
-
57
-
58
-
59
-
60
-
61
-
62
-
63
-
64
-
65
-
66
-
67
-
68
-
69
-
70
-
71
-
72
-
73
-
74
-
75
-
76
-
77
-
78
-
79
-
80
-
81
-
82
-
83
-
84
-
85
-
86
-
87
-
88
-
89
-
90
-
 91
91 -
 92
92 -
 93
93 -
 94
94 -
 95
95 -
 96
96 -
 97
97 -
 98
98 -
 99
99 -
 100
100 -
 101
101 -
 102
102 -
 103
103 -
 104
104 -
 105
105 -
 106
106 -
 107
107 -
 108
108 -
 109
109 -
 110
110 -
 111
111 -
112
-
113
-
114
-
115
-
116
-
117
-
118
-
119
-
120
-
121
 |
 |

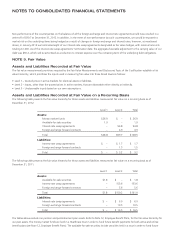
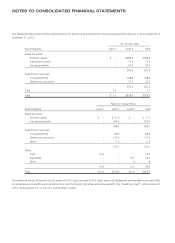
NOTES TO CONSOLIDATED FINANCIAL STATEMENTS
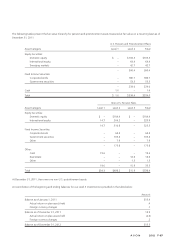
The following tables present the fair value hierarchy for pension and postretirement assets measured at fair value on a recurring basis as of
December 31, 2012:
U.S. Pension Plans
Asset Category Level 1 Level 2 Total
Equity Securities:
Domestic equity $ – $186.4 $186.4
International equity – 71.0 71.0
Emerging markets – 50.5 50.5
– 307.9 307.9
Fixed Income Securities:
Corporate bonds – 148.0 148.0
Government securities – 72.2 72.2
– 220.2 220.2
Cash 1.1 – 1.1
Total $ 1.1 $528.1 $529.2
Non-U.S. Pension Plans
Asset Category Level 1 Level 2 Level 3 Total
Equity Securities:
Domestic equity $ – $ 71.3 $ – $ 71.3
International equity – 297.4 – 297.4
– 368.7 – 368.7
Fixed Income Securities:
Corporate bonds – 85.9 – 85.9
Government securities – 113.3 – 113.3
Other – 11.5 – 11.5
– 210.7 – 210.7
Other:
Cash 16.4 – – 16.4
Real estate – – 13.1 13.1
Other – – .4 .4
16.4 – 13.5 29.9
Total $16.4 $579.4 $13.5 $609.3
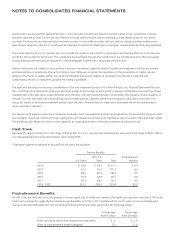
As mentioned above, during the second quarter of 2012 approximately $40 of assets previously designated and intended to be used solely
for postretirement benefits were transferred to a trust that funds both active and retiree benefits (the “healthcare trust”). At December 31,
2012, there were no U.S. or non-U.S. postretirement assets.