Avon 2012 Annual Report Download - page 45
Download and view the complete annual report
Please find page 45 of the 2012 Avon annual report below. You can navigate through the pages in the report by either clicking on the pages listed below, or by using the keyword search tool below to find specific information within the annual report.-
 1
1 -
2
-
3
-
4
-
5
-
6
-
7
-
8
-
9
-
10
-
11
-
12
-
13
-
14
-
15
-
16
-
17
-
18
-
19
-
20
-
21
-
22
-
23
-
24
-
25
-
26
-
27
-
28
-
29
-
30
-
31
-
32
-
33
-
34
-
 35
35 -
 36
36 -
 37
37 -
 38
38 -
 39
39 -
 40
40 -
 41
41 -
 42
42 -
 43
43 -
 44
44 -
 45
45 -
 46
46 -
 47
47 -
 48
48 -
 49
49 -
 50
50 -
 51
51 -
 52
52 -
 53
53 -
 54
54 -
 55
55 -
56
-
57
-
58
-
59
-
60
-
61
-
62
-
63
-
64
-
65
-
66
-
67
-
68
-
69
-
70
-
71
-
72
-
73
-
74
-
75
-
76
-
77
-
78
-
79
-
80
-
81
-
82
-
83
-
84
-
85
-
86
-
87
-
88
-
89
-
90
-
91
-
92
-
93
-
94
-
95
-
96
-
97
-
98
-
99
-
100
-
101
-
102
-
103
-
104
-
105
-
106
-
107
-
108
-
109
-
110
-
111
-
112
-
113
-
114
-
115
-
116
-
117
-
118
-
119
-
120
-
121
 |
 |

PART II
Operating margin was negatively impacted by .2 points as compared to the prior-year period from higher CTI restructuring. Adjusted Non-
GAAP operating margin declined 4.4 points, or 3.9 points on a Constant $ basis, primarily as a result of:
• a nonrecurring benefit of .4 points associated with the VAT settlement in the United Kingdom that occurred in 2011;
• a decline of 2.0 points due to lower gross margin caused primarily by 1.4 points from higher supply chain costs due to foreign exchange,
primarily due to the weakening of the Turkish Lira against the Euro, as well as increased product costs in Fashion and Home. The
unfavorable net pricing and mix negatively impacted gross margin by .9 points, driven by smart value offerings; and
• a decline of .9 points from higher bad debt expense primarily due to a higher provision to increase reserves for bad debt in South Africa as
a result of growth in new territories, of which .4 points was an out-of-period adjustment, and was also negatively impacted by a change
in estimate of the collection of our receivables.
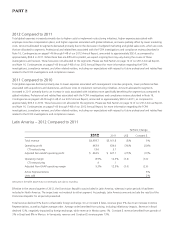
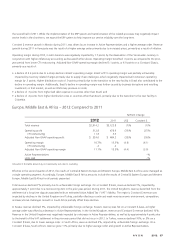
Europe, Middle East & Africa – 2011 Compared to 2010
%/Point Change
2011 2010 US$ Constant $
Total revenue $3,122.8 $3,047.9 2% –%
Operating profit 478.9 474.3 1% (2)%
CTI restructuring 5.3 6.3
Adjusted Non-GAAP operating profit $ 484.2 $ 480.6 1% (3)%
Operating margin 15.3% 15.6% (.3) (.4)
CTI restructuring .2 .2
Adjusted Non-GAAP operating margin 15.5% 15.8% (.3) (.4)
Active Representatives –%
Units sold (3)%
Amounts in the table above may not necessarily sum due to rounding.
Total revenue increased 2% due to favorable foreign exchange. On a Constant $ basis, revenue was flat, as Active Representatives and
average order were flat. The region’s revenue in 2011 was favorably impacted by approximately 1 point due to a benefit to the United
Kingdom’s revenue resulting from the settlement of a long time dispute associated with the VAT liability. The region’s Constant $ revenue
benefited by growth in Turkey and South Africa, which was offset by declines in Russia and the United Kingdom. The region experienced
Constant $ growth through the first nine months of 2011 but saw declines in the fourth quarter, partly due to the negative impact of the
continued difficult economic environment on Fashion and Home sales. The inclusion of Liz Earle Beauty Co. Limited (“Liz Earle”) in our 2011
results for the unmatched period through March favorably impacted the region’s revenue growth by approximately 1 point.
During 2011, revenue in Russia declined 1%. On a Constant $ basis, revenue declined 4% in Russia due to declines in average order as well as
Active Representatives. During the latter part of 2011, we believe Russia’s performance was also impacted by weak trends in the Beauty category
market in that country. Revenue in South Africa increased 31%, partially benefiting from favorable foreign exchange. On a Constant $ basis,
revenue in South Africa increased 29%, due to growth in Active Representatives which was partially attributable to growth in new territories.
Revenue in Turkey declined 5%, due to unfavorable foreign exchange, while on a Constant $ basis Turkey grew 5%, due to growth in Active
Representatives and higher average order. In the United Kingdom, revenue declined by 1% including benefits from favorable foreign exchange as
well as the VAT settlement. On a Constant $ basis, revenue in the United Kingdom declined by 4%, primarily due to a decline in Active
Representatives and lower average order, partially offset by the VAT settlement, which benefited the Constant $ growth rate by 4 points.
Operating margin and adjusted Non-GAAP operating margin declined .3 points, or .4 points on a Constant $ basis, primarily as a result of:
• a decline of .8 points from increased overhead expenses;
• a decline of approximately .6 points related to increased investments in RVP. RVP investment increased in 2011 in part to address the
increased social benefit taxes levied against certain Representatives beginning in 2010 in Russia;
• a benefit of .5 points from lower advertising costs; and
• a benefit of .4 points associated with the VAT settlement in the United Kingdom that occurred in 2011.