Avon 2012 Annual Report Download - page 106
Download and view the complete annual report
Please find page 106 of the 2012 Avon annual report below. You can navigate through the pages in the report by either clicking on the pages listed below, or by using the keyword search tool below to find specific information within the annual report.-
 1
1 -
2
-
3
-
4
-
5
-
6
-
7
-
8
-
9
-
10
-
11
-
12
-
13
-
14
-
15
-
16
-
17
-
18
-
19
-
20
-
21
-
22
-
23
-
24
-
25
-
26
-
27
-
28
-
29
-
30
-
31
-
32
-
33
-
34
-
35
-
36
-
37
-
38
-
39
-
40
-
41
-
42
-
43
-
44
-
45
-
46
-
47
-
48
-
49
-
50
-
51
-
52
-
53
-
54
-
55
-
56
-
57
-
58
-
59
-
60
-
61
-
62
-
63
-
64
-
65
-
66
-
67
-
68
-
69
-
70
-
71
-
72
-
73
-
74
-
75
-
76
-
77
-
78
-
79
-
80
-
81
-
82
-
83
-
84
-
85
-
86
-
87
-
88
-
89
-
90
-
91
-
92
-
93
-
94
-
95
-
 96
96 -
 97
97 -
 98
98 -
 99
99 -
 100
100 -
 101
101 -
 102
102 -
 103
103 -
 104
104 -
 105
105 -
 106
106 -
 107
107 -
 108
108 -
 109
109 -
 110
110 -
 111
111 -
 112
112 -
 113
113 -
 114
114 -
 115
115 -
 116
116 -
117
-
118
-
119
-
120
-
121
 |
 |

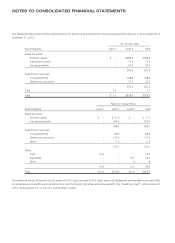
Depreciation and Amortization
2012 2011 2010
Latin America $ 74.3 $ 72.8 $ 54.2
Europe, Middle East & Africa 47.0 60.3 52.1
North America 50.8 60.4 51.4
Asia Pacific 21.2 18.6 16.5
Total from operations 193.3 212.1 174.2
Global and other 36.3 27.5 20.6
Total depreciation and amortization $ 229.6 $239.6 $194.8
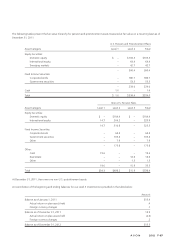
Total Revenue by Major Country
2012 2011 2010
Brazil $ 2,041.7 $ 2,316.3 $ 2,182.8
U.S. 1,588.8 1,719.7 1,828.6
All other 7,086.6 7,255.6 6,851.4
Total $10,717.1 $11,291.6 $10,862.8
A major country is defined as one with total revenues greater than 10% of consolidated total revenues.
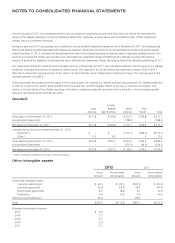
Long-Lived Assets by Major Country
2012 2011 2010
U.S. $ 840.7 $1,088.7 $1,297.8
Brazil 409.1 418.8 450.2
All other 1,330.2 1,322.0 1,307.5
Total $2,580.0 $2,829.5 $3,055.5
A major country is defined as one with long-lived assets greater than 10% of consolidated long-lived assets. Long-lived assets primarily
include property, plant and equipment and intangible assets. The U.S. and Brazil’s long-lived assets consist primarily of property, plant and
equipment related to manufacturing and distribution facilities.
Revenue by Product Category
2012 2011 2010
Beauty(1) $ 7,642.7 $ 8,067.8 $ 7,671.3
Fashion(2) 1,891.7 1,995.5 2,016.5
Home(3) 1,011.7 1,048.7 1,043.5
Net sales 10,546.1 11,112.0 10,731.3
Other revenue(4) 171.0 179.6 131.5
Total revenue $10,717.1 $11,291.6 $10,862.8
(1) Beauty includes color cosmetics, fragrances, skin care and personal care.
(2) Fashion includes fashion jewelry, watches, apparel, footwear, accessories, and children’s products.
(3) Home includes gift and decorative products, housewares, entertainment and leisure products, children’s products and nutritional products.
(4) Other revenue primarily includes shipping and handling and order processing fees billed to Representatives.
A V O N 2012 F-41