Avon 2012 Annual Report Download - page 95
Download and view the complete annual report
Please find page 95 of the 2012 Avon annual report below. You can navigate through the pages in the report by either clicking on the pages listed below, or by using the keyword search tool below to find specific information within the annual report.-
 1
1 -
2
-
3
-
4
-
5
-
6
-
7
-
8
-
9
-
10
-
11
-
12
-
13
-
14
-
15
-
16
-
17
-
18
-
19
-
20
-
21
-
22
-
23
-
24
-
25
-
26
-
27
-
28
-
29
-
30
-
31
-
32
-
33
-
34
-
35
-
36
-
37
-
38
-
39
-
40
-
41
-
42
-
43
-
44
-
45
-
46
-
47
-
48
-
49
-
50
-
51
-
52
-
53
-
54
-
55
-
56
-
57
-
58
-
59
-
60
-
61
-
62
-
63
-
64
-
65
-
66
-
67
-
68
-
69
-
70
-
71
-
72
-
73
-
74
-
75
-
76
-
77
-
78
-
79
-
80
-
81
-
82
-
83
-
84
-
 85
85 -
 86
86 -
 87
87 -
 88
88 -
 89
89 -
 90
90 -
 91
91 -
 92
92 -
 93
93 -
 94
94 -
 95
95 -
 96
96 -
 97
97 -
 98
98 -
 99
99 -
 100
100 -
 101
101 -
 102
102 -
 103
103 -
 104
104 -
 105
105 -
106
-
107
-
108
-
109
-
110
-
111
-
112
-
113
-
114
-
115
-
116
-
117
-
118
-
119
-
120
-
121
 |
 |

NOTES TO CONSOLIDATED FINANCIAL STATEMENTS
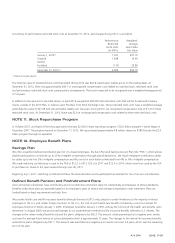
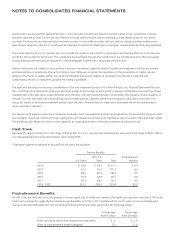
A summary of stock options as of December 31, 2012, and changes during 2012, is as follows:
Shares
(in 000’s)
Weighted-
Average
Exercise
Price
Weighted-
Average
Contractual
Term
Aggregate
Intrinsic
Value
Outstanding at January 1, 2012 28,361 $31.30
Granted 1,775 18.24
Exercised (556) 15.50
Forfeited (377) 23.63
Expired (2,913) 29.69
Outstanding at December 31, 2012 26,290 $31.00 4.3 $2.2
Exercisable at December 31, 2012 22,580 $31.76 3.8 $ .1
At December 31, 2012, there was approximately $3.8 of unrecognized compensation cost related to stock options outstanding. That cost is
expected to be recognized over a weighted-average period of 1.3 years. We recognize expense on stock options using a graded vesting
method, which recognizes the associated expense based on the timing of option vesting dates.
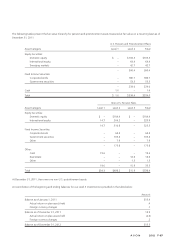
Cash proceeds, tax benefits, and intrinsic value related to total stock options exercised during 2012, 2011, and 2010, were as follows:
2012 2011 2010
Cash proceeds from stock options exercised $ 8.6 $16.8 $23.9
Tax (obligation)/ benefit realized for stock options exercised (3.7) 1.3 3.3
Intrinsic value of stock options exercised 2.2 10.0 14.6
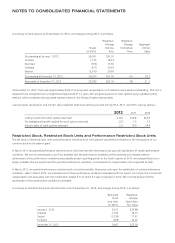
Restricted Stock, Restricted Stock Units and Performance Restricted Stock Units
The fair value of restricted stock units and performance restricted stock units granted was determined based on the closing price of our
common stock on the date of grant.
In March 2011 we granted performance restricted stock units that vest after three years only upon the satisfaction of certain performance
conditions. We accrue compensation cost if it is probable that the performance conditions will be achieved and reassess whether
achievement of the performance conditions are probable at each reporting period. In the fourth quarter of 2011, we assessed that it is no
longer probable that we would meet the specified performance conditions, and reversed the compensation cost recognized to-date.
In March 2012, we granted performance restricted stock units that vest after three years only upon the satisfaction of certain performance
conditions. Later in March 2012, we amended one of these performance conditions associated with this award. As a result, the incremental
compensation cost associated with this modification totaled $.9, of which $.3 was recognized in 2012. We currently believe that the
achievement of the performance conditions is probable.
A summary of restricted stock and restricted stock units at December 31, 2012, and changes during 2012, is as follows:
Restricted
Stock
And Units
(in 000’s)
Weighted-
Average
Grant-Date
Fair Value
January 1, 2012 3,317 $23.88
Granted 1,792 18.13
Vested (1,233) 17.41
Forfeited (409) 24.07
December 31, 2012 3,467 $23.18