Avon 2012 Annual Report Download - page 102
Download and view the complete annual report
Please find page 102 of the 2012 Avon annual report below. You can navigate through the pages in the report by either clicking on the pages listed below, or by using the keyword search tool below to find specific information within the annual report.-
 1
1 -
2
-
3
-
4
-
5
-
6
-
7
-
8
-
9
-
10
-
11
-
12
-
13
-
14
-
15
-
16
-
17
-
18
-
19
-
20
-
21
-
22
-
23
-
24
-
25
-
26
-
27
-
28
-
29
-
30
-
31
-
32
-
33
-
34
-
35
-
36
-
37
-
38
-
39
-
40
-
41
-
42
-
43
-
44
-
45
-
46
-
47
-
48
-
49
-
50
-
51
-
52
-
53
-
54
-
55
-
56
-
57
-
58
-
59
-
60
-
61
-
62
-
63
-
64
-
65
-
66
-
67
-
68
-
69
-
70
-
71
-
72
-
73
-
74
-
75
-
76
-
77
-
78
-
79
-
80
-
81
-
82
-
83
-
84
-
85
-
86
-
87
-
88
-
89
-
90
-
91
-
 92
92 -
 93
93 -
 94
94 -
 95
95 -
 96
96 -
 97
97 -
 98
98 -
 99
99 -
 100
100 -
 101
101 -
 102
102 -
 103
103 -
 104
104 -
 105
105 -
 106
106 -
 107
107 -
 108
108 -
 109
109 -
 110
110 -
 111
111 -
 112
112 -
113
-
114
-
115
-
116
-
117
-
118
-
119
-
120
-
121
 |
 |

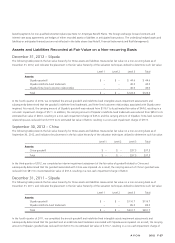
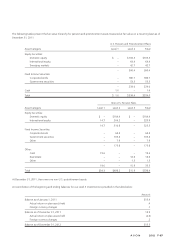
The following tables present the fair value hierarchy for pension and postretirement assets measured at fair value on a recurring basis as of
December 31, 2011:
U.S. Pension and Postretirement Plans
Asset Category Level 1 Level 2 Total
Equity Securities:
Domestic equity $ – $193.3 $193.3
International equity – 64.4 64.4
Emerging markets – 42.7 42.7
– 300.4 300.4
Fixed Income Securities:
Corporate bonds – 180.7 180.7
Government securities – 53.3 53.3
– 234.0 234.0
Cash 1.6 – 1.6
Total $ 1.6 $534.4 $536.0
Non-U.S. Pension Plans
Asset Category Level 1 Level 2 Level 3 Total
Equity Securities:
Domestic equity $ – $104.4 $ – $104.4
International equity 14.7 206.2 – 220.9
14.7 310.6 – 325.3
Fixed Income Securities:
Corporate bonds – 64.3 – 64.3
Government securities – 103.4 – 103.4
Other – 7.9 – 7.9
– 175.6 – 175.6
Other:
Cash 19.6 – – 19.6
Real estate – – 14.6 14.6
Other – – 1.3 1.3
19.6 – 15.9 35.5
Total $34.3 $486.2 $15.9 $536.4
At December 31, 2011, there were no non-U.S. postretirement assets.
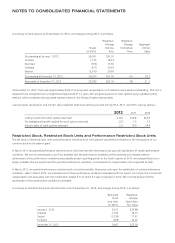
A reconciliation of the beginning and ending balances for our Level 3 investments is provided in the table below:
Amount
Balance as of January 1, 2011 $15.4
Actual return on plan assets held .4
Foreign currency changes .1
Balance as of December 31, 2011 15.9
Actual return on plan assets held (2.6)
Foreign currency changes .2
Balance as of December 31, 2012 $13.5
A V O N 2012 F-37