Avon 2012 Annual Report Download - page 44
Download and view the complete annual report
Please find page 44 of the 2012 Avon annual report below. You can navigate through the pages in the report by either clicking on the pages listed below, or by using the keyword search tool below to find specific information within the annual report.-
 1
1 -
2
-
3
-
4
-
5
-
6
-
7
-
8
-
9
-
10
-
11
-
12
-
13
-
14
-
15
-
16
-
17
-
18
-
19
-
20
-
21
-
22
-
23
-
24
-
25
-
26
-
27
-
28
-
29
-
30
-
31
-
32
-
33
-
 34
34 -
 35
35 -
 36
36 -
 37
37 -
 38
38 -
 39
39 -
 40
40 -
 41
41 -
 42
42 -
 43
43 -
 44
44 -
 45
45 -
 46
46 -
 47
47 -
 48
48 -
 49
49 -
 50
50 -
 51
51 -
 52
52 -
 53
53 -
 54
54 -
55
-
56
-
57
-
58
-
59
-
60
-
61
-
62
-
63
-
64
-
65
-
66
-
67
-
68
-
69
-
70
-
71
-
72
-
73
-
74
-
75
-
76
-
77
-
78
-
79
-
80
-
81
-
82
-
83
-
84
-
85
-
86
-
87
-
88
-
89
-
90
-
91
-
92
-
93
-
94
-
95
-
96
-
97
-
98
-
99
-
100
-
101
-
102
-
103
-
104
-
105
-
106
-
107
-
108
-
109
-
110
-
111
-
112
-
113
-
114
-
115
-
116
-
117
-
118
-
119
-
120
-
121
 |
 |

the second half of 2011. While the implementation of the ERP system and transformation of the related processes may negatively impact
service levels in the short-term, we expect the ERP system to help improve our service reliability over the long-term.
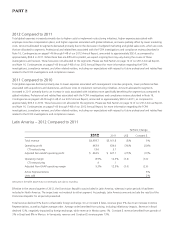
Constant $ revenue growth in Mexico during 2011, was driven by an increase in Active Representatives and a higher average order. Revenue
growth during 2011 in Venezuela was the result of a higher average order primarily due to increased prices, primarily as a result of inflation.
Operating margin during 2010, in Latin America was negatively impacted by 1.7 points by the devaluation of the Venezuelan currency in
conjunction with higher inflationary accounting as discussed further above. Operating margin benefited .3 points as compared to the prior-
year period from lower CTI restructuring. Adjusted Non-GAAP operating margin declined 3.1 points, or 4.9 points on a Constant $ basis,
primarily as a result of:
• a decline of 3.4 points due to a sharp decline in Brazil’s operating margin. Brazil’s 2011 operating margin was partially unfavorably
impacted by inventory related charges primarily due to supply chain challenges, which negatively impacted Latin America’s operating
margin by .3 points. Higher distribution costs of .9 points primarily due to the transition to the new facility in Brazil also contributed to the
decline in operating margin. Additionally, Brazil’s decline in operating margin was further caused by business disruptions and resulting
investments in that market, as well as inflationary pressure on costs;
• a decline of .7 points from higher bad debt expense in countries other than Brazil; and
• a decline of .4 points from higher distribution costs in countries other than Brazil, primarily due to the transition to the new facility in
Colombia.
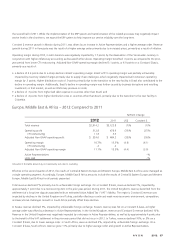
Europe, Middle East & Africa – 2012 Compared to 2011
%/Point Change
2012 2011 US$ Constant $
Total revenue $2,914.2 $3,122.8 (7)% (1)%
Operating profit 312.8 478.9 (35)% (27)%
CTI restructuring 11.8 5.3
Adjusted Non-GAAP operating profit $ 324.6 $ 484.2 (33)% (26)%
Operating margin 10.7% 15.3% (4.6) (4.1)
CTI restructuring .4 .2
Adjusted Non-GAAP operating margin 11.1% 15.5% (4.4) (3.9)
Active Representatives –%
Units sold –%
Amounts in the table above may not necessarily sum due to rounding.
Effective in the second quarter of 2012, the results of Central & Eastern Europe and Western Europe, Middle East & Africa were managed as
a single operating segment. Accordingly, Europe, Middle East & Africa amounts include the results of Central & Eastern Europe and Western
Europe, Middle East & Africa for all periods presented.
Total revenue declined 7% primarily due to unfavorable foreign exchange. On a Constant $ basis, revenue declined 1%, impacted by
approximately 1 point due to a nonrecurring item in the prior-year period. During 2011, the United Kingdom’s revenue benefited from the
settlement of a long time dispute associated with an estimated Value Added Tax (“VAT”) liability. The region’s Constant $ revenue was
impacted by declines in the United Kingdom and Turkey, partially reflecting a continued weak macroeconomic environment, competition,
and executional challenges. Growth in South Africa partially offset these declines.
In Russia, revenue declined 5%, impacted by unfavorable foreign exchange. Russia’s revenue was flat on a Constant $ basis, as higher
average order was offset by a decrease in Active Representatives. In the United Kingdom, revenue and Constant $ revenue declined 10%.
Revenue in the United Kingdom was negatively impacted by a decrease in Active Representatives, as well as by approximately 4 points due
to the benefit of the VAT settlement in the prior-year period that did not recur in 2012. In Turkey, revenue declined 10%, or 3% on a
Constant $ basis, due to lower average order. In South Africa, revenue declined 2%, impacted by unfavorable foreign exchange. On a
Constant $ basis, South Africa’s revenue grew 11% primarily due to higher average order and growth in Active Representatives.
A V O N 2012 37