Avon 2012 Annual Report Download - page 109
Download and view the complete annual report
Please find page 109 of the 2012 Avon annual report below. You can navigate through the pages in the report by either clicking on the pages listed below, or by using the keyword search tool below to find specific information within the annual report.-
 1
1 -
2
-
3
-
4
-
5
-
6
-
7
-
8
-
9
-
10
-
11
-
12
-
13
-
14
-
15
-
16
-
17
-
18
-
19
-
20
-
21
-
22
-
23
-
24
-
25
-
26
-
27
-
28
-
29
-
30
-
31
-
32
-
33
-
34
-
35
-
36
-
37
-
38
-
39
-
40
-
41
-
42
-
43
-
44
-
45
-
46
-
47
-
48
-
49
-
50
-
51
-
52
-
53
-
54
-
55
-
56
-
57
-
58
-
59
-
60
-
61
-
62
-
63
-
64
-
65
-
66
-
67
-
68
-
69
-
70
-
71
-
72
-
73
-
74
-
75
-
76
-
77
-
78
-
79
-
80
-
81
-
82
-
83
-
84
-
85
-
86
-
87
-
88
-
89
-
90
-
91
-
92
-
93
-
94
-
95
-
96
-
97
-
98
-
 99
99 -
 100
100 -
 101
101 -
 102
102 -
 103
103 -
 104
104 -
 105
105 -
 106
106 -
 107
107 -
 108
108 -
 109
109 -
 110
110 -
 111
111 -
 112
112 -
 113
113 -
 114
114 -
 115
115 -
 116
116 -
 117
117 -
 118
118 -
 119
119 -
120
-
121
 |
 |

NOTES TO CONSOLIDATED FINANCIAL STATEMENTS
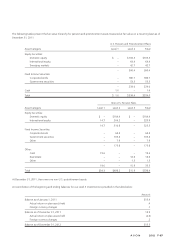
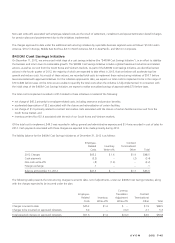
The following table presents the restructuring charges incurred to date, net of adjustments, under our 2005 and 2009 Restructuring Programs:
Employee-
Related
Costs
Asset
Write-offs
Inventory
Write-offs
Currency
Translation
Adjustment
Write-offs
Contract
Terminations/
Other Total
Charges incurred on approved initiatives $482.5 $10.8 $7.2 $11.6 $21.6 $533.7
The charges, net of adjustments, of initiatives under the 2005 and 2009 Restructuring Programs by reportable business segment were as
follows:
Latin
America
Europe,
Middle East
& Africa
North
America
Asia
Pacific Corporate Total
2005 $ 3.5 $ 12.7 $ 6.9 $22.4 $ 6.1 $ 51.6
2006 34.6 52.0 61.8 14.2 29.5 192.1
2007 14.9 69.8 7.0 4.9 12.7 109.3
2008 1.9 20.7 (1.1) (.7) (3.0) 17.8
2009 19.2 52.5 26.7 19.9 12.0 130.3
2010 13.6 (.8) 17.8 (.3) 11.0 41.3
2011 2.1 1.9 (1.1) (.3) .8 3.4
2012 (7.8) (1.0) (1.7) (.4) (1.2) (12.1)
Charges incurred on approved initiatives $82.0 $207.8 $116.3 $59.7 $67.9 $533.7
The amounts shown in the tables above as charges recorded to date relate to initiatives that have been approved and recorded in the
financial statements as the costs are probable and estimable.
Additional Restructuring Charges 2012
In an effort to improve operating performance, we identified certain actions in 2012 that we believe will enhance our operating model,
reduce costs, and improve efficiencies. In addition, management approved the relocation of our corporate headquarters in New York City.
As a result of the analysis and the actions taken, during 2012, we recorded total costs to implement these various restructuring initiatives of
$73.9 before taxes associated with approved initiatives, and the costs consisted of the following:
• net charge of $53.4 primarily for employee-related costs, including severance and pension benefits;
• contract termination costs of $12.0 associated with the relocation of our corporate headquarters;
• implementation costs of $5.8 for professional service fees; and
• accelerated depreciation of $2.7 associated with the relocation of our corporate headquarters.
Total costs to implement were recorded in selling, general and administrative expenses for the year ended December 31, 2012. The majority
of future cash payments associated with these charges are expected to be made during 2013.
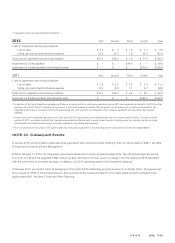
The liability balance for these various restructuring initiatives as of December 31, 2012 is as follows:
Employee-
Related
Costs
Contract
Terminations/
Other Total
2012 Charges $ 53.4 $12.0 $ 65.4
Cash payments (33.9) (.2) (34.1)
Non-cash write-offs (1.6) – (1.6)
Foreign exchange (.3) – (.3)
Balance at December 31, 2012 $ 17.6 $11.8 $ 29.4