Avon 2012 Annual Report Download - page 27
Download and view the complete annual report
Please find page 27 of the 2012 Avon annual report below. You can navigate through the pages in the report by either clicking on the pages listed below, or by using the keyword search tool below to find specific information within the annual report.-
 1
1 -
2
-
3
-
4
-
5
-
6
-
7
-
8
-
9
-
10
-
11
-
12
-
13
-
14
-
15
-
16
-
 17
17 -
 18
18 -
 19
19 -
 20
20 -
 21
21 -
 22
22 -
 23
23 -
 24
24 -
 25
25 -
 26
26 -
 27
27 -
 28
28 -
 29
29 -
 30
30 -
 31
31 -
 32
32 -
 33
33 -
 34
34 -
 35
35 -
 36
36 -
 37
37 -
38
-
39
-
40
-
41
-
42
-
43
-
44
-
45
-
46
-
47
-
48
-
49
-
50
-
51
-
52
-
53
-
54
-
55
-
56
-
57
-
58
-
59
-
60
-
61
-
62
-
63
-
64
-
65
-
66
-
67
-
68
-
69
-
70
-
71
-
72
-
73
-
74
-
75
-
76
-
77
-
78
-
79
-
80
-
81
-
82
-
83
-
84
-
85
-
86
-
87
-
88
-
89
-
90
-
91
-
92
-
93
-
94
-
95
-
96
-
97
-
98
-
99
-
100
-
101
-
102
-
103
-
104
-
105
-
106
-
107
-
108
-
109
-
110
-
111
-
112
-
113
-
114
-
115
-
116
-
117
-
118
-
119
-
120
-
121
 |
 |
PART II
ITEM 5. MARKET FOR REGISTRANT’S COMMON EQUITY, RELATED STOCKHOLDER
MATTERS AND ISSUER PURCHASES OF EQUITY SECURITIES
Market for Avon’s Common Stock
Our common stock is listed on The New York Stock Exchange and trades under the AVP ticker symbol. At December 31, 2012, there were
approximately 15,387 holders of record of our common stock. We believe that there are many additional shareholders who are not
“shareholders of record” but who beneficially own and vote shares through nominee holders such as brokers and benefit plan trustees. High
and low market prices and dividends per share of our common stock, in dollars, for 2012 and 2011 are listed below. For information
regarding future dividends on our common stock, see the “Liquidity and Capital Resources” section within MD&A on pages 42 through 47.
2012 2011
Quarter High Low
Dividends
Declared
and Paid High Low
Dividends
Declared
and Paid
First $19.63 $17.41 $.23 $30.14 $26.16 $.23
Second 23.52 15.10 .23 30.91 27.22 .23
Third 16.65 14.45 .23 28.90 19.60 .23
Fourth 17.39 13.80 .06 23.85 16.09 .23
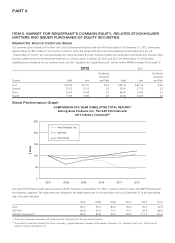
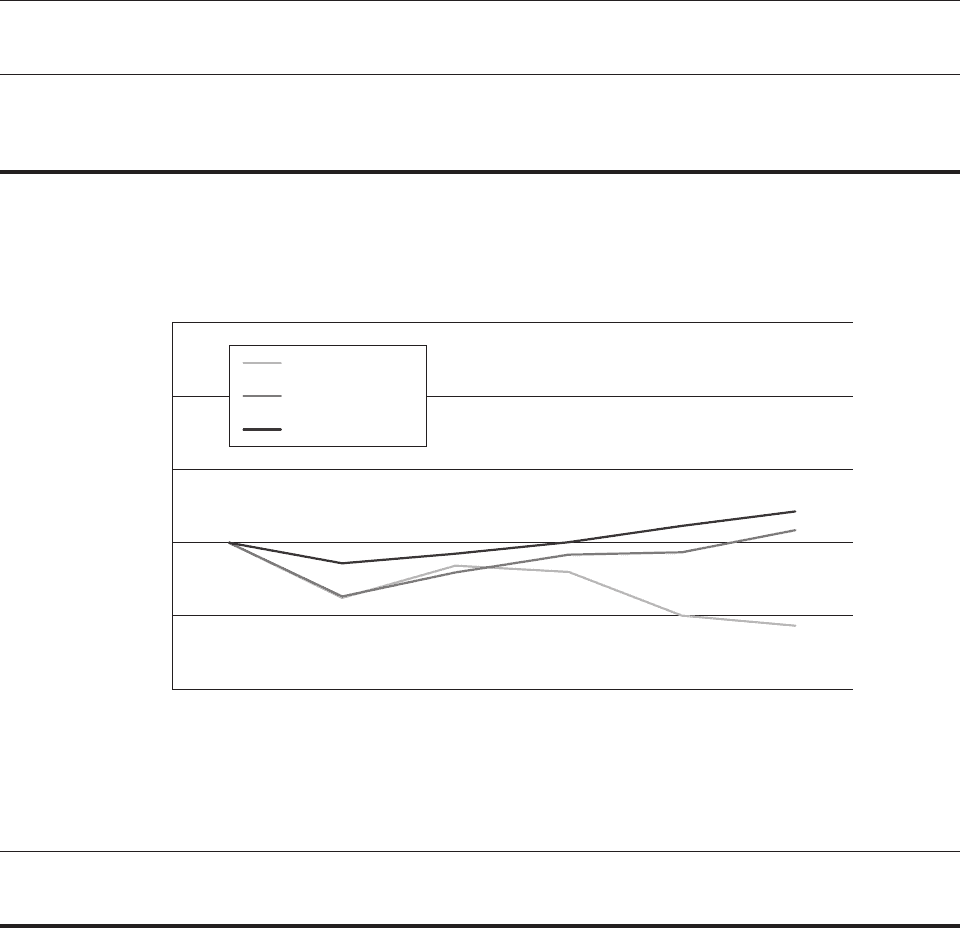
Stock Performance Graph
COMPARISON OF 5 YEAR CUMULATIVE TOTAL RETURN(1)
Among Avon Products, Inc., The S&P 500 Index and
2012 Industry Composite(2)
0
50
100
150
200
250
2007 2008 2009 2010 2011
$ Value
2012
Avon Products, Inc.
S&P 500
Peer Group
The Stock Performance Graph above assumes a $100 investment on December 31, 2007, in Avon’s common stock, the S&P 500 Index and
the Industry Composite. The dollar amounts indicated in the graph above and in the chart below are as of December 31 or the last trading
day in the year indicated.
2007 2008 2009 2010 2011 2012
Avon 100.0 62.3 84.2 80.0 50.0 42.9
S&P 500 100.0 63.0 79.7 91.7 93.6 108.6
Industry Composite(2) 100.0 85.8 92.5 100.3 111.7 121.5
(1) Total return assumes reinvestment of dividends at the closing price at the end of each quarter.
(2) The Industry Composite includes The Clorox Company, Colgate–Palmolive Company, Estée Lauder Companies, Inc., Kimberly Clark Corp., The Procter &
Gamble Company and Revlon, Inc.