Avon 2012 Annual Report Download - page 37
Download and view the complete annual report
Please find page 37 of the 2012 Avon annual report below. You can navigate through the pages in the report by either clicking on the pages listed below, or by using the keyword search tool below to find specific information within the annual report.
PART II
2012 Compared to 2011
Revenue
Total revenue in 2012 compared to 2011 decreased 5% due to unfavorable foreign exchange. Constant $ revenue was relatively
unchanged, as a 1% increase in average order was offset by a 1% decline in Active Representatives. Growth in units sold and the net impact
of price and mix were flat.
On a category basis, revenue growth rates were as follows:
%/Point Change
US$ Constant $
Beauty (5)% 1%
Beauty Category:
Fragrance (4) 2
Color (6) 1
Skincare (7) (1)
Personal Care (6) –
Fashion (5) (2)
Home (4) 2
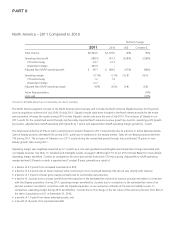
As noted previously in our Overview section, our Constant $ revenue was impacted by improvements in Latin America, particularly in Brazil,
Mexico, and Venezuela; however, these improvements were offset by net declines in other regions. In Europe, Middle East & Africa we saw a
revenue decline in the United Kingdom that partially reflects a continued weak macroeconomic environment, competition, and executional
challenges. In addition, North America experienced challenging financial results, partially as a result of the ongoing impact of field transformation
and redistricting in the U.S. Asia Pacific’s revenue decline was primarily due to continuing weak performance of our China operations.
For additional discussion of the changes in revenue by segment, see the “Segment Review” section of this MD&A.
Gross Margin
Gross margin decreased by 220 basis points compared to 2011, while adjusted Non-GAAP gross margin decreased 230 basis points,
primarily due to the following:
• a decline of 100 basis points due to higher supply chain costs, primarily caused by increased product costs which were partially due to
inflationary pressures;
• a decline of 80 basis points due to the unfavorable net impact of product mix and pricing, partly due to an increase in smart value
offerings as well as other initiatives to flow excess inventory; and
• a decline of 50 basis points due to the negative impact of foreign exchange.
Selling, General and Administrative Expenses
Selling, general and administrative expenses for 2012 decreased $45.4 compared to 2011. This decrease is primarily due to lower distribution costs
and lower advertising, partially offset by the negative impact of foreign exchange and higher costs to implement (“CTI”) restructuring initiatives.
Selling, general and administrative expenses as a percentage of revenue increased 240 basis points compared to 2011, while adjusted Non-
GAAP selling, general, and administrative expenses as a percentage of revenue increased 160 basis points, primarily due to the following:
• an increase of 80 basis points due to higher overhead expenses, primarily associated with wage inflation in 2012, as well as higher
expenses associated with employee incentive compensation plans;
• an increase of 50 basis points due to increased investments in RVP, primarily driven by investments in the One Simple Sales Model in the
U.S., partially offset by lower investments in China;
• an increase of 50 basis points due to the negative impact of foreign exchange; and
• a decrease of 30 basis points due to lower advertising costs.
In the first quarter of 2012, we revised the definition of RVP to represent the expenses of activities directly associated with Representatives
and independent leaders including the cost of incentives and sales aids (net of any fees charged). RVP no longer includes strategic
investments such as the Service Model Transformation and Web enablement, and it no longer adjusts for the impact of volume.


